
Effects of stenotic severity on the flow structure in a circular channel under a pulsatile flow
Stenosis is the drastic reduction in the cross-sectional area of blood vessel caused by accumulations of cholesterol. It affects the blood flow property and structure from the fluid dynamic point of view. To understand the flow phenomenon more clearly, a particle image velocimetry method is used and the fluid dynamic characteristics in a circular channel containing stenosis structure is investigated experimentally in this study. Different stenotic-structured models made of acrylic material are subjected to a pulsatile flow generated by an in-house designed pulsatile pump. The inner diameter of the tube inlet is 20 mm and the length of reduced area for stenosis ranges between 35mm and 40mm. It is circulated continuously through a circular channel by the pump system. Pressure is measured at four different sections during systolic and diastolic phase changes. The phase-averaged velocity field distribution shows a recirculation regime after the stenotic structure. The effects of the stenotic obstructions are found to be more severe when the aspect ratio is varied.
Keywords:
Stenosis, Particle image velocimetry, Pulsatile flow, Pressure, Aspect ratio1. Introduction
Atherosclerosis is a type of cardiovascular disease affecting the human circulatory system. The development of atherosclerosis strongly correlates with the accumulation of low density lipoproteins (LDL) commonly known as stenosis [1]. The formation of stenotic structure in the arterial system causes a drastic reduction in the cross-section of blood vessels and affects the hemodynamic properties of blood.
While blood passes through a stenotic conduit, recirculation zones are generated in the downstream side of the stenosis by an abrupt variation in velocity and pressure. These recirculation zones may damage endothelial cells, leading to a rupture of the blood vessels depending on the flow conditions and morphology of the stenotic structure [2][3]. Therefore, studying the formation of these recirculation zones under different pathological and physiological conditions is very important. Similarly, determining the effects of pulsatile flow on the post-stenotic region would also be interesting.
In the past, both in-vitro and in-vivo experiments were conducted to measure the fluid dynamic characteristics in a stenotic channel [4][5]. The results provided useful information about the flow structure considering the effect of stenotic geometry and the focus has been the stenotic region. However, these studies lack measurement and visualization in the post-stenotic region, such as the formation and growth of recirculation zones. The recent development of more accurate and advance measurement techniques has made it possible to visualize a larger flow field at the same instant [6][7].
For the hemodynamic relevances, the recirculation zone observed in the post of stenotic structure should be investigated to indicate turbulence occurrence. This may adversely affect the hemo-rheological features leading to a rupture of the blood vessel in severe conditions. In this study, we conducted a particle image velocimetry (PIV) experiment to visualize a pulsatile flow through a stenotic channel with different stenosis severity and aspect ratios (AR) for blood flow relevances. The pulsatile flow was circulated using an in-house designed pulsatile pump. The results were in good agreement with those in the literature.
2. Experimental Apparatus and Method
Figure 1 shows the schematic of the experimental set-up used in this experiment. The PIV measurement system consisted of a CCD camera with a resolution of 1K x 1K and attached 570 nm low pass filter, BNC function generator and a pulse-type Nd:YAG laser system with power of 30 mJ and wavelength of 532 nm. The fluorescent particles were used as the tracer with emitted wavelength of 550 nm and excitation wavelength of 580 nm. The low pass filter helps increase the contrast between the acquired image and the background.

Schematics of the PIV measurement system
A tubular structure made of acrylic material and containing a stenotic obstruction inside the channel was used as shown in Figure 2. The inner diameter of the tube inlet (D0) was 20mm and the length of reduced are arranged between 35mm and 40mm. Stenosiss happened dimensions were modelled using a parameter defining the inside obstruction rate, i.e., the stenosis severity (Figure 2(b)). Stenosis severity is defined as the ratio of the reduced diameter (D0 ㅡ Di) to the inner diameter of stenosis inlet (D0). That is,


Schematics of the stenotic structure model used in this study. (a) dimension and variables; (b) photograph of the stenosis models ((a) stenosis severity 0.25, AR=2.00, (b) stenosis severity 0.50, AR=2.00, (c) stenosis severity 0.50, AR=1.75))
An in-house designed pulsatile pump connected to the water tank was used to provide variable pressure at the entrance of the circular channel (Figure 1).
This pulsatile pump works in the same manner as the human heart [8]. Functions such as the heart rate and the systolic-diastolic rate can be controlled using its rpm and duty ratio respectively. Rpm controls the cycle of pump rotation similar to the heart rate and duty-ratio regulates the speed of the piston between the bottom dead centre (BDC) and the top dead centre (TDC) as the heart moves at different diastolic and systolic speed during one cycle. This study used 30, 60 and 90 rpm and a duty ratio of 2:8 to 5:5.
The position of piston was synchronized with the phases between systolic and diastolic condition. At 90° crank angle, the flow velocity reaches maximum value representing the systolic point. The velocity decreases when the piston moves to the BDC and reaches the minimum value at a crank angle of 270°. The flow speed variations between the critical phases show similar pattern with intermediate increments respectively. Therefore, the piston motions of four phases corresponding to 0°, 90°, 180° and 270° crank angles were mainly considered in this study. Table 1 shows the specifications variables used in this study.

Secifications of variable parameters considered in the present study.
Couple images were captured by the PIV system in each position and further processing was conducted by using Insight 3G software. Figure 3 shows a sample raw-seeded particle image obtained for the velocity calculation process. To obtain a clear image of the velocity field around a stenotic structure, the time interval between two image frames was set to Dt = 100 ∼ 150ms for 4 to 6 pixels/frame movement. The interrogation window size was 64 × 64 pixels with 50% overlap. To obtain the time-averaged flow structure, 30 instantaneous velocity fields were obtained for each phase. These instantaneous velocity fields were ensemble-averaged to obtain the spatial distributions of the mean velocity and turbulence statistics.

Sample raw image used for image processing
Human blood is a non-Newtonian fluid and its characteristics are variable depending on the diameter of the blood vessels. However, this study assumes the working fluid to be Newtonian and to be made up of completely soluble glycerine in distilled water, with a density of 1.18 g/ml and viscosity of 5.02 cP at 22.5 oC [9].
3. Results and Discussion
Figure 4 shows the consecutive mean streamwise velocity distributions around the stenotic structure in the mid-section of the channel at different pulsatile flow phases. All the images were achieved for a model with stenosis severity of 0.5 and AR of 1.75. The measurements were made at crank angles of 0°, 90°, 180° and 270° with a fixed pulsatile pump duty ratio of 4:6 a t90 rpm speed. In the mean velocity field inside stenotic structure, the pulsatile flow accelerated as it went downstream the stenotic region (Figure 4(b)). In all cases of the crank angle, recirculation zones were observed behind the trailing edge of the stenosis part and velocity magnitudes were found to be smaller than the maximum velocity at the trailing edge. The highest magnitude of velocity was found during the systolic part of the pump (crank angle= 90°, 180°) and not in the diastolic part (crank angle=0°, 270°). The increase in flow velocity caused a relative increase in the recirculation zone which is directly related to the momentum increase of wake in the stenotic downstream region [10].

Consecutive mean streamwise velocity distribution at different pulsatile flow phases. (Stenosis severity =0.50, AR=1.75, duty ratio= 4:6, 90 rpm). (a) crank angle=0°; (b) crank angle=90°; (c) crank angle=180°; (d) crank angle=270°
The effect of duty ratio and pump speed on the maximum velocity was determined by conducting measurements at two different positions of the piston in the cylinder, i.e., at the extreme positions of BDC and in the middle of the cylinder (MC). To study the effect of duty ratio on the maximum flow, we set up three experimental groups corresponding to human heart conditions. A pump speed of 60 rpm was considered for human static breathing and 90 rpm for a more active state such as jogging and fast track walking. A comparison was made with the slowest pump speed of 30 rpm.
Figure 5(a) shows the maximum flow velocity at each phase angle with increasing duty ratio for three different stenosis models at a pump speed of 30 rpm. Theoretically, the maximum velocity is achieved when the piston reaches the MC, and the maximum pressure is built when the piston passes through BDC. With increasing duty ratio, the velocity magnitude for a stenosis severity of 0.50 (model (b) in Figure 2(b)) is much higher than that of other models with a small stenosis and AR (models (a) and (c) in Figure 2(b)). Moreover, the difference in the velocity magnitude is the highest between MC and BDC for a model with a stenosis severity of 0.50 and AR=2.00 compared with those in other stenosis models. Therefore, a severe stenosis with a larger AR increases the flow velocity at low pump speed.

Maximum velocity distribution at each phase angle according to duty ratio variation. (a) 30 rpm; (b) 60 rpm; (c) 90 rpm
Figure 5(b) shows the maximum velocity distribution plotted against duty ratio at a pump speed of 60 rpm. The plot shows an overall increase in the maximum velocity for all stenosis models because of the increase in pump speed compared with those in Figure 5(a). The patterns of the maximum velocity profiles are similar, with a reduction in maximum velocity difference between MC and BDC. A continuous decrease in maximum velocity was also observed when the piston passed through MC, with increasing duty ratio for a stenosis severity of 0.50 and AR=1.75 (model (c)). This finding is caused by the effect of the shortest AR of the stenosis model compared with that of other models.
Figure 5(c) shows the maximum velocity variations against increasing duty ratio at a pump speed of 90rpm. The magnitude of maximum velocity is the highest in all cases and the difference of velocity has increased for the three stenotic models, respectively. However, the difference in maximum velocity at piston position between MC and BDC for each model was relatively reduced. We suppose that as the circulating speed increases, the effects of stenosis severity and AR become serious; i.e., the blood vessels in a human circulatory system may rupture.
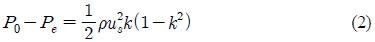
Figure 6 shows the pressure drop distribution for each model with varying flow velocities taken from the velocity field measurement results. To evaluate the pressure drop induced by flow momentum loss, we determined the correlations using the mean flow velocity in the stenosis regime. For a simple pressure drop calculation, the modified Bernoulli equation and continuity relations were employed before and after the stenotic structure, respectively. The overall pressure drops can be obtained with the summation of each pressure decreases. Finally, the pressure drop difference is related to the flow velocity and the cross-sectional area reduction;

Pressure drop distribution according to Reynolds number variations
where, P0 and Pe denote the pressure before and after the stenosis regime, ρ is the fluid density, us is the mean flow velocity at the stenosis and k is the ratio of stenotic channel cross-sectional area (As) to the main channel cross-sectional area (A0).
An almost constant pressure drop pattern was observed in the channel regime, except in the stenotic region. In the stenotic structure regime, a linear relationship between the pressure drop and Reynolds number has been observed because of a faster velocity in this regime and in the streamline convergences. Therefore, the stenosis formation phenomenon in the larger arteries such as the aorta, may cause severe blood velocity increments and large pressure drop variations [11].
4. Conclusion
In this study, the effects of pulsatile flow on the stenosis structure in a circular channel were investigated using the PIV velocity field measurement technique with variations in stenotic severity and length. The results achieved in different positions of the piston show that the recirculation regime appeared in the post-stenotic region. The increase in flow velocity caused a relative increase in the recirculation zone, which is directly related to the momentum increase in wake in the stenotic downstream region.
With increasing rpm, the effects of stenosis severity and AR on the flow velocity showed serious tendency toward blood vessels rupture. A fixed pressure drop in a normal arterial flow became linear with increasing velocity in the stenotic region. This study suggests that stenosis formation seriously indicates blood vessel rupture with high systolic and diastolic velocities and pressure for higher stenosis severity and AR.
Acknowledgments
This work was supported by a National Research Foundation of Korea (NRF) grant funded by the Korea government (MEST) (No. 2012R1A2A2A01046099), and a grant from the Priority Research Centers Program through the National Research Foundation of Korea (NRF) funded by MEST (No. 2012-0005856).
Notes
References
-
J. V. Soulis, T. M. Farmakis, G. D. Giannoglou, and G. E. Louridas, “Wall shear stress in normal left coronary artery tree”, Journal of Biomechanics, 39(4), p742-779, (2006).
[https://doi.org/10.1016/j.jbiomech.2004.12.026]

-
M. Ojha, C. Cobbold, K. W. Johnston, and R. L. Hummel, “Pulsatile flow through constricted tubes: An experimental investigation using photochromic tracer methods”, Journal of Fluid Mechanics, 203, p173-197, (1989).
[https://doi.org/10.1017/S0022112089001424]
-
S. S. Varghese, and S. H. Frankel, “Numerical modeling of pulsatile turbulent flow in stenotic vessels”, Journal of Biomechanical Engineering, 125, p445-460, (2003).
[https://doi.org/10.1115/1.1589774]
-
S. A. Ahmed, and D. P. Giddens, “Velocity measurements in steady flow through axisymmetric stenosis at moderate reynolds number”, Journal of Biomechanics, 16, p505-516, (1983).
[https://doi.org/10.1016/0021-9290(83)90065-9]
- M. Kang, H. S. Ji, and K. C. Kim, “In-vitro investigation of RBCs’ flow characteristics and hemodynamic feature through a micro channel with a micro-stenosis”, International Journal of Biology and Biomedical Engineering, 2, p1-8, (2008).
-
M. Siebes, B. J. Verhoeff, M. Meuwissen, R. J. Winter, J. A. E. Spaan, J. J. Piek, “Single-wire pressure and flow velocity measurement to quantify coronary stenosis hemodynamics and effects of percutaneous interventions”, Circulation, 109, p756-762, (2004).
[https://doi.org/10.1161/01.CIR.0000112571.06979.B2]
-
K. M. Marques, H. J. Spruijt, C. Boer, N. Westerhof, C. A. Visser, and F. C. Visser, “The diastolic flow-pressure gradient relation in coronary stenoses in humans”, Journal of the American College of Cardiology, 39(10), p1630-1636, (2002).
[https://doi.org/10.1016/S0735-1097(02)01834-X]
-
Y. H. Joo, K. W. Kim, Y. H. Lee, M. K. Kwak, C. Y. Lee, J. M. Lee, and C. W. Park, “Design of pulsatile pump and performance test for pulsatile flow generation”, Journal of the Korean Society of Marine Engineering, 37(2), p149-155, (2013).
[https://doi.org/10.5916/jkosme.2013.37.2.149]
- Y. I. Cho, K. R. Kensey, “Effects of the non-Newtonian viscosity of blood on hemodynamics of diseased arterial flows: Part 1, steady flows”, Biorheology, 28, p241-262, (1991).
-
R. C. Lima, C. R. Andrade, E. L. Zaparoli, “Numerical study of three recirculation zones in the unilateral sudden expansion flow”, International Communications in Heat and Mass Transfer, 35, p1053-1060, (2008).
[https://doi.org/10.1016/j.icheatmasstransfer.2008.07.004]
- W. J. Yang, Biothermal Fluid Sciences, Principles and Applications, Hemisphere, New York, (1989).