Quantitative risk analysis for gas leak and dispersion in cargo compressor room of 174K ME-GI LNG vessels
1Department of Ship Hull Piping Design, Daewoo Shipbuilding & Marine Engineering Co., Ltd, Tel: 055-735-4335 sangwon@dsme.co.kr2Graduate School of Marine System Engineering, Korea Maritime and Ocean University, Tel: 051-410-4260 shaoyude@kmou.ac.kr
3Division of Marine System Engineering, Korea Maritime and Ocean University, Tel: 051-410-4258 kimyt@kmou.ac.kr
Copyright ⓒ The Korean Society of Marine Engineering
This is an Open Access article distributed under the terms of the Creative Commons Attribution Non-Commercial License (http://creativecommons.org/licenses/by-nc/3.0), which permits unrestricted non-commercial use, distribution, and reproduction in any medium, provided the original work is properly cited.
Abstract
Recently, many high-pressure gas-fueled liquefied natural gas (LNG) vessels combined with high-pressure fuel gas compressors or high-pressure pumps/vaporizers have been built because LNG fuel is considered environmentally friendly and satisfies the International Maritime Organization (IMO) requirements. However, there are many reasons to examine its safety requirements, such as gas leakage, explosion, and fire. Because LNG carriers under the IGC code have sailed for long time, there are many adequate safety regulations available. However, safety regulations for LNG-fueled vessels are still insufficient because LNG-fueled vessels with the IGF code do not have enough reference. Most safety regulations applied for the IGF code are in accordance with the safety requirements of IGC code to cover the insufficient safety regulations in IGF code and to prevent risk in LNG-fueled vessels. In particular, the gas-detection system applied in the machinery room by IGF/IGC code only defines the number of gas detectors. There are no rules for their locations, so the gas detectors are installed in agreement among the ship owners, shipyard, and classification societies. The minimum number of detectors in a machinery room (cargo compressor room) by IGF/IGC code is three, but there are no rules for the detecting points. Therefore, ship owners do not heavily rely on the detecting system defined by IGF/IGC code. Therefore, this study considers gas dispersion in the cargo compressor room of an LNG carrier equipped with high-pressure cargo-handling equipment, bringing up reasonable methods of safety regulation and the number and locations of gas detectors specified in the IGF/IGC code. To perform LNG gas-dispersion simulation in the cargo compressor room, the geometry of the cargo compressor room and the arrangement of the equipment and piping are designed with the same 3-dimensional size as the actual structures in the vessel. Scenarios for a gas leak were examined for high pressure of 305 bar. Pinhole sizes for high pressure are 4.5 mm, 5.0 mm, and 5.6 mm. The results show that the cargo compressor room of 174K ME-GI LNG vessels has no serious risk areas regarding the flammable gas concentration, as it is verified that the ventilation assessment was safe for a 5.6-mm pinhole for a high-pressure leak and gas-rupture condition. However, based on the computation fluid dynamics (CFD) simulation, it is verified that the actual gas-detection sensors in the cargo compressor room should be moved to other optimum points and their quantity should be increased. The CFD results of this study will be useful for risk-based design and analysis, and optimum gas-detection points can be applied.
Keywords:
CFD, Gas dispersion, Gas leak, IGF/IGC code, LNG vessels1.Introduction
The International Maritime Organization (IMO) has adopted regulations to address the emission of air pollutants from ships and has adopted mandatory energy-efficiency measures to reduce emission of greenhouse gases from international shipping under Annex VI of IMO’s pollution-prevention treaty (MARPOL). Additionally, IMO regulates air pollutants from international shipping, particularly nitrogen oxide (NOx) and sulfur oxide (SOx) emitted from ships. The NOx emission limit values are dependent on the maximum operating speed (n, rpm) of the engines, as defined in Table 1[1]. The NOx control requirements of Annex VI apply to installed marine diesel engines of over 130 kW output power, other than those used solely for emergency purposes irrespective of the tonnage of the ship. The Tier-I and -II limit values are global, whereas the Tier-III values are applied to NOx-emission control areas.
The sulfur limit values and implementation dates are listed in Table 2[1]. Marpol Annex VI regulation includes caps on the sulfur content of fuel oil as a measure to control SOx emissions. Rigorous fuel quality provisions are required in the emission control area (ECA) compared with the global area. Furthermore, IMO adopted mandatory technical and operational energy-efficiency measures, which are expected to greatly reduce the amount of CO2 emissions from international shipping in 2011. These mandatory measures, the Energy-Efficiency Design Index (EEDI), and the Ship Energy-Efficiency Management Plan (SEEMP) were enforced on January 1, 2013.
To comply with recent IMO requirements, liquefied natural gas (LNG) fuel is in the limelight as an effective solution. Today, many vessels equipped with LNG fuel have been built worldwide. LNG is considered the most environmentally friendly fossil fuel because it has the lowest CO2 emissions per unit of energy and because it is suitable for use in high-efficiency combined-cycle power stations. For an equivalent amount of heat, burning natural gas produces about 30% less carbon dioxide than burning petroleum and about 45% less than burning coal. However, LNG is easily vaporized to 600 times its liquid volume and becomes a flammable gas when mixed with air. its flammability range is about 5–15 volume percent. LNG cargo-handling equipment is located in the cargo compressor room. Hazardous areas are classified into zones 0, 1, and 2 in accordance with IEC 60092-502; they are based on an assessment of the frequency of the occurrence and duration of an explosive gas atmosphere. The cargo compressor room is in zone 1, where an explosive gas atmosphere is likely to occur during normal operation.
Recently, nearly 30 174K ME-GI LNG vessels for carrying cryogenic liquefied natural gas at -163 °C have been designed and constructed with typical cargo handling equipment and piping arrangements. However, there are many reasons to examine the safety requirements, such as gas leakage, explosion, and fire considerations. Therefore, it is positively necessary to install the optimum number of gas-detection sensors in the appropriate locations. For this study, computational fluid dynamics (CFD) code, which is used throughout the industry, was used. CFD code has become a useful tool for assessing risks and analyzing safety in industry, and the use of CFD for gas dispersion and risk assessment is expected to increase [2]. In particular, ANSYS FLUENT 14.0 is appropriate software that can solve the Navier–Stokes equations for gas flow, coupled with the energy and diffusion equations, to simulate the gas mixture by modeling each chemical species independently [3]. Therefore, the commercial CFD code FLUENT has been used to carry out the gas simulation. CFD code had been used in various places in the field of shipbuilding engineering. However, the research by K. P. Kim et al. [4][5] is the first and only study regarding gas dispersion and explosion in the machinery room of a gas-fueled ship. To analyze the leaked gas dispersion and quantify the potential overpressure for a very large crude oil carrier (VLCC), the CFD codes CFX and FLACS were used. This research analyzes the gas leak and dispersion for a high-pressure leak depending on the scenarios that could occur. The ventilation capability in the cargo compressor room and gas-detection sensor locations were verified through comparison between real gas-detection sensors and virtual monitoring points.
2.GA of Cargo System
The main function of the cargo-handling equipment in the cargo compressor room is tabulated below in Table 3.
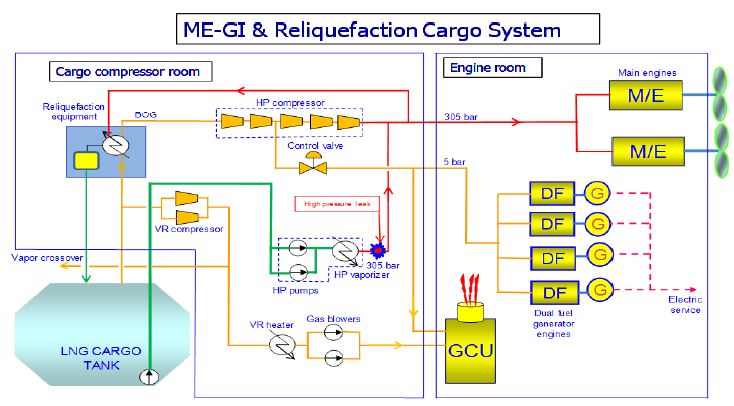
Figure 1 shows the general arrangement of the ME-GI and reliquefaction system in cargo compressor room of model ship. The main fuel gas consumers are two (2) ME-GI main engines and four (4) dual fuel-generator engines (DFGEs), which are located in the engine room. Fuel gas at 305 bar can be supplied by a high-pressure fuel gas compressor or high-pressure pump/vaporizer. Reliquefaction equipment, which is located in the cargo compressor room, and the gas combustion unit (GCU), which is located in the engine room, can be used in case of excessive boil-off gas (BOG) treatment.
New IGC code specifies that the artificial ventilation inlet and outlets shall be arranged to ensure sufficient air movement through the space to avoid accumulation of flammable, toxic, or asphyxiant vapors, and to ensure a safe working environment. The ventilation system shall have a capacity of not less than 30 changes of air per hour, based upon the total volume of the space. IGC code 13.6.12 specifies that in every installation, the number and positions of the detection heads shall be determined with due regard to the size and layout of the compartment. Therefore, a reasonable method to meet the safety regulation in terms of the number and location of gas detectors, as specified in the IGF/IGC code [6], are considered.
The main objectives of the study are as follows.
- Modeling of cargo compressor room structure, equipment, and piping.
- Setting the physical properties of the actual condition.
- Examination of CFD dispersion modeling in the cargo compressor room according to specific scenarios.
- Verification of the ventilator capabilities.
- Determination of optimum gas-detection points compared to the positions of real gas-detection sensors.
3.Methodology
3.1 Numerical methodology
From the aspect of safety engineering, it is important to examine the possible consequences of fuel leakage from a valve or pipeline by the fuel’s gas or vapor phase. The risk of an explosion is directly related to the dispersion behavior of leaked fuels. Therefore, consideration of the behavior of gas dispersion must be an essential part of the design process for any new installation in LNG-fueled ships.
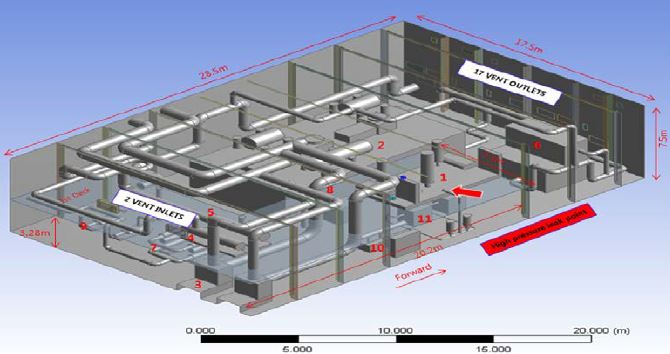
An LNG gas-dispersion simulation is developed in the cargo compressor room, 174K LNG vessel is designed with same 3-dimensional size not only equipment size but also compressor room geometry. The initial conditions and leak scenario are defined according to the pinholes size and described in Table 4. Figure 2 shows the virtual space, which is designed to be 28.5 m × 17.5 m × 7.5 m based on the arrangement of the 174K LNG vessel equipped with a high-pressure fuel gas compressor for ME-GI main engines and reliquefaction equipment.
Commercial CFD code is used with ANSYS Fluent 14.0 to carry out the simulation for this study. This utilizes the finite-volume method (FVM) to discretize the computational equation and domains. The continuity equation, three-dimensional momentum, k-ε turbulence model, and chemical species are applied [7]. LNG gas-dispersion simulations were carried out in a cargo compressor room in accordance with the pinhole sizes, the boundary condition was set to two (2) input pressure sources at natural vents, seventeen (17) pressure outputs at mechanical ventilators and mass-flow inlets at leak points. Moreover, to produce a realistic gas-dispersion simulation, the physical properties of actual LNG gas were used.
To simulate the gas leak, Equation (1) and Equation (2)[8][9] were used to determine the value of the mass flow rate dm/dt.
| (1) |
Here, dm/dt, cd, Ah, P0, Wg, γ, R, and T represent the mass flow rate, coefficient of leak(leakage (cd = 0.97), area of the pinhole, pipe internal pressure, molecular weight, specific heat ratio (cp/cv), gas constant, and gas temperature, respectively. And tThe constant, K, in the Equation (2) is related to the gas leakage rate.
| (2) |
3.2 Leak scenario
Many researchers [10]-[12] have reported that the working pressure, mass flow rate of leaking gas, size of the rupture, release position, and release time are some of the major factors affecting the risk of an accident.
LNG gas leak scenarios consist of high-pressure and low-pressure leaks. A high-pressure leak was assumed at the high-pressure pump/vaporizer discharge pipe located on the partial deck in the middle of the cargo compressor room. The leak scenario for high-pressure gas was composed of three (3) cases, pinhole diameter sizes of 4.5 mm, 5.0, mm and 5.6 mm, and the transient flow calculation was carried out for 503 s. The pinhole size of 5.6 mm in Table 5 was assumed as the rupture case at the maximum capacity of the high-pressure pump/vaporizer. One (1) of the gas-detection sensors, which is the nearest point to 30% of the lower flammable limit (LFL) among the total of four (4) sensors would alarm after the gas leak, and then the leaked gas was continuously discharged for 10 seconds and then stopped. Mechanical ventilators were continuously operated before and after the leak, and the methane gas behavior and capabilities of ventilation could be monitored in this study.
4.Results & Discussion
4.1 Distribution of CH4 mass fraction
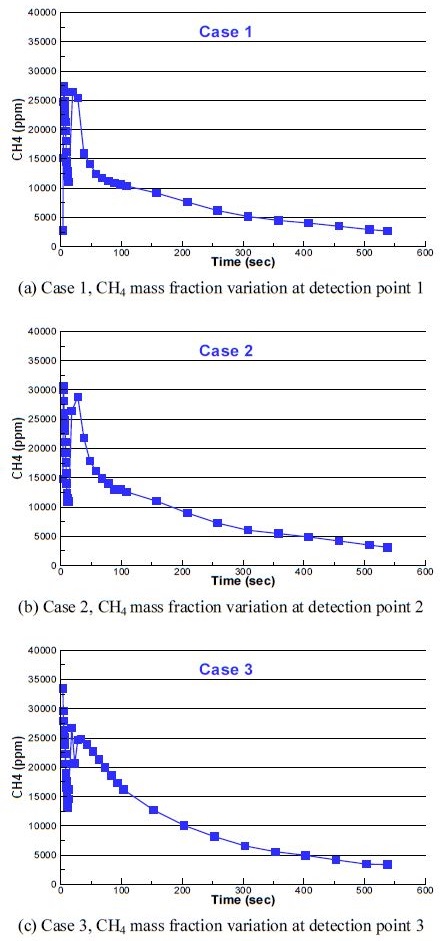
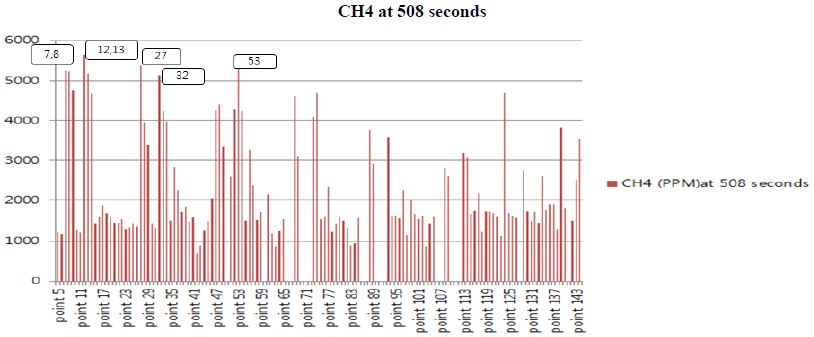
Table 6 shows the leak flow rate, gas detection alarm time after the leak starting from the high-pressure pump/vaporizer, CH4 mass fraction after 10 seconds and CH4 mass fraction at 508 seconds as final transient flow calculation. Gas leak is continued during 10 seconds after the gas alarm and is stopped. Only mechanical ventilators are then operated without gas leak. The first gas detection alarm is monitored at the No.1 location for all three (3) cases. The highest CH4 mass fraction at 10 seconds after alarm is monitored at the case 3 as the fuel gas supply rupture case. Final measuring at 508 seconds is monitored without flammable concentration all measuring values are below 5,000 ppm.
Figure 3 illustrates the 2D and 3D plots of the CH4 mass fraction according to Table 6. There are a total of four (4) detection points. The gas cloud is captured at the first alarm point for each case, and the gas cloud shown below is from the 30% LFL (0.015) to 0.15. Although the flammability limit is between 0.05 and 0.15, the gas-detection alarm occurs at 30% LFL (0.015). Therefore, the gas cloud behavior was observed between 0.015 (15,000 ppm) and 0.5 (500,000 ppm). All cases were monitored with similar gas behavior, as shown in Figure 4.The contour resulting from the CH4 mass fraction is collected in Case 3 with the highest gas content. The gas cloud was vertically positioned from the pinhole surface of the pipe and dispersed to the ceiling and the walls. The gas cloud behavior was captured from the gas-detection alarm to the 10 seconds for each case. Their sizes were proportional to the leak flow rate. All cases reached 30% LFL (15,000 ppm) within 5 seconds from the beginning of the leak at gas-detection point 1, and gradually decreased afterward. The gas leak was stopped after 10 s of sensing the alarm. The CH4 mass fractions in the 7-m, 4-m, and 1-m planes at the final measuring time were all lower values than 8,000 ppm. The monitoring values for all gas detection points were 5,000 ppm or less after 300 s. Through the results, we can confirm the coincidence based on the knowledge that CH4 gas is lighter than air.
4.2 Gas detecting system
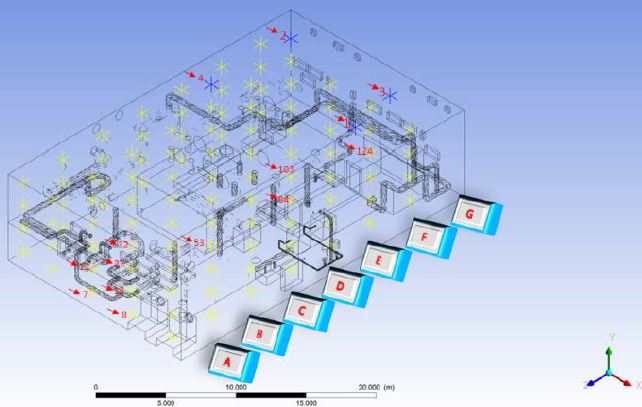
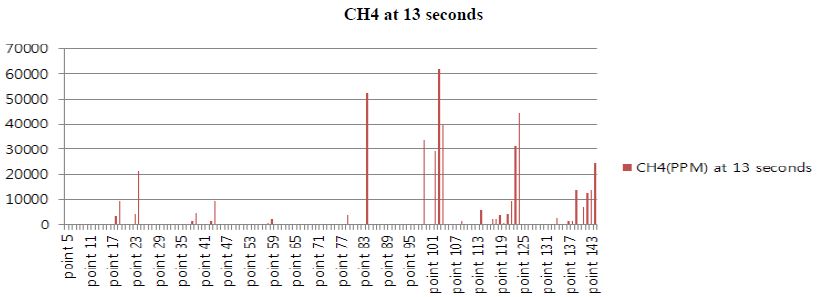
Figure 5 shows virtual monitor points in the cargo compressor room. A total 140 virtual points were selected except for the existing gas-detection points. The number of virtual monitoring points was 5 in the X direction, 4 in the Y direction, and 7 in the Z direction for analyzing the CH4 mass fraction. The number of virtual monitor points ranged from 5 to 144. The naming scheme in the Z-direction is from A to G, and 20 virtual monitor points composed the 7 X-Y planes.
Figure 6 and Figure 7 show the CH4 mass fraction 10 s after the gas-detection alarm and 504 seconds after Case 3. As shown in Figure 4, the gas behavior for Cases 1, 2, and 3 are similar. So, the leak rate for case 3 is analyzed. The highest CH4 concentration exceeding 50,000 ppm was found at virtual monitoring points 84, 103, and 124, and was between 40,000 and 50,000 ppm. All these points were located in the highest position. It is confirmed that the gas leaked at 305 bar and 43 °C is distributed to the ceiling because it is lighter than the ambient air. Points 7, 8, 12, and 13 were located in the farthest and lowest positions from the ventilators, on the right-hand side of the cargo compressor room because the leak point was located on the right side and dispersed along the wall. Points 27, 32, and 53 were on the rear side of the high-pressure fuel gas compressor, and it was verified that the remaining gas could not be easily ventilated due to the high-pressure fuel gas compressor with a large obstacle size of 3,000 × 8,150 × 5,000 mm (W × D × H).
5.Conclusions
This study presented a method to identify and quantify the risk of explosion. To do this, an LNG gas-dispersion simulation in the cargo compressor room of a 174K ME-GI LNG vessel was carried out according to the leak mass flow rate. The geometry of the cargo compressor room, arrangement of the equipment, and the piping arrangement were designed at a 1-to-1 scale of the those of the actual ship. The LNG gas leak and dispersion were analyzed according to the pinhole size. Scenarios for the gas leak were examined at 305 bar with pinhole sizes of 4.5 mm, 5.0 mm, and 5.6 mm. Transient gas simulations were adopted to determine the values of various time steps. The boundary condition of the leaked gas pressure, temperature, leaked mass flow rate, and ventilator pressure were selected to be the same as those in the real system. Through this study, the following points were identified.
(1) The leaked gas dispersion could be visualized and quantitative data were obtained.
(2) The flammable region could be visualized and identified.
(3) The ventilation capability was identified with various scenarios.
(4) The optimum gas-detection sensor locations could be identified by comparison among the real gas sensors and virtual monitor sensor locations.
Moreover, we identified the gas-detection sensor locations by analyzing the virtual monitor points by CFD simulation. The real gas detection sensors should be moved to locations near points 7, 8, 12, and 13 and points 27, 32, and 53. Additional gas-detection sensors should be applied, or the real gas sensors at points 1 and 2 should be moved to the locations with no ventilation. The CFD results from this study will be useful for risk-based design and analysis for the application of optimum gas-detecting points.
Acknowledgments
This work was part of “Test evaluation for LNG bunkering equipments and development of test technology(Grant No.:20180048)”supported by the Ministry of Oceans and Fisheries of Korea government.
References
- International : IMO Marine Engine Regulations, http://www.dieselnet.com/standard/inter/imo.php Accessed September 1, 2017.
-
H. K. Kang, “An examination on the dispersion characteristics of boil-off gas in vent mast exit of membrane type LNG carriers”, Journal of the Korean Society of Marine Environment & Safety, 19(2), p225-231, (2013).
[https://doi.org/10.7837/kosomes.2013.19.2.225]

- F. Gavelli, E. Bullister, and H. Kytomma, “Applied of CFD(Fluent) to LNG spills into geometrically”, Journal of Hazardous Materials, 159(1), p158-168, (2008).
-
K. P. Kim, H. K. Kang, C. H. Choung, and J. H. Park, “On the application of CFD codes for natural gas dispersion and explosion in gas fuelled ship”, Journal of the Korean Society of Marine Engineering", 35(7), p946-956, (2011).
[https://doi.org/10.5916/jkosme.2011.35.7.946]

-
K. P. Kim, Y. T. Kim, and H. K. Kang, “CFD approach on gas explosion for SIL in gas fuelled ship”, Journal of the Korean Society of Marine Engineering, 39(2), p195-200, (2015).
[https://doi.org/10.5916/jkosme.2015.39.2.195]

- Resolution MSC 370(93), “Amendments to the international code for the construction and equipment of ships carrying liquefied gases in bulk”, IMO, (2014).
- ANSYS, “FLUENT-14 solver theory manual”, (2011).
- M. J. Assael, and K. E. Kakosimos, “Fires, explosions, and toxic gas dispersion: Effects calculation and risk analysis”, CRC Press, 35-40, 67-69, 149-150, (2010).
-
J. W. Choi, and L. N. Li, “Analysis of risk assessment factors for gas leakage and dispersion in underground power plant”, Journal of ILASS-Korea, 20(2), p101-106, (2015), (in Korean).
[https://doi.org/10.15435/jilasskr.2015.20.2.101]

-
G. Dong, L. Xue, and Y. Yang, “Evaluation of hazard range for the natural gas jet released from a high-pressure pipeline: A computational parametric study”, Journal of Loss Prevention in the Process Industries, 23(4), p522-530, (2010).
[https://doi.org/10.1016/j.jlp.2010.04.007]

-
S. Dan, C. J. Lee, J. Part, D. Shin, and E. S. Yoon, “Quantitative risk analysis of fire and explosion on the top-side LNG liquefaction process of LNG-FPSO”, Process Safety and Environmental Protection, 92(5), p430-441, (2014).
[https://doi.org/10.1016/j.psep.2014.04.011]

-
L. Li, J. Choi, J. Bang, S. Lee, S. Lee, and D. Kim, “Numerical investigation of LNG gas dispersion in a confined space: An engineering model”, Journal Mechanical Science and Technology, 31(3), p4533-4540, (2017).
[https://doi.org/10.1007/s12206-017-0853-2]


