복잡한 선박 통신망 인터페이스의 통합관리시스템(TMS)에 대한 QualNet 성능평가
Copyright © The Korean Society of Marine Engineering
This is an Open Access article distributed under the terms of the Creative Commons Attribution Non-Commercial License (http://creativecommons.org/licenses/by-nc/3.0), which permits unrestricted non-commercial use, distribution, and reproduction in any medium, provided the original work is properly cited.
초록
최근 선박이 해상에서의 독립적인 구조물을 넘어 육상에서 함께 관리하는 자산으로 바뀜으로써 선박 기술이 발전함에 따라 선내 텔레콤 시스템 또한 발전되고 있다. 현대의 선박은 매우 다양한 텔레콤 장비들이 설치되어 있다. 따라서 각 장비들의 개별적인 케이블들이 매우 복잡하게 포설되어있다. 이로 인해 설치비용 및 유지보수 비용이 매우 급격하게 증가한다. 이러한 선박 내 복잡하고 다양한 텔레콤 시스템들을 효율적으로 관리하기 위해 TMS 기반의 새로운 통합 인터페이스 체계가 제안되었다. 이 체계에는 다양한 장비들로부터 발생하는 다양한 데이터 유형들을 하나의 통신체계로 수렴시키는 역할을 하는 TIU가 포함되어 있다. 우리는 TMS 기반의 통신망 인터페이스의 성능을 평가하기 위해 대표적인 통신망 시뮬레이터인 QualNet을 이용하였다. QualNet 상에 기존 선박통신망 환경, TIU와 TMS 환경을 구축하였고, 이 환경에서 종단 간의 지연시간과 처리율에 대한 전반적인 선박 통신망의 성능을 측정하였다.
Abstract
In recent years, ships have changed from independent structures at sea into a collection of assets that are managed on land. As ship technology advances, in-vessel telecom systems are also being developed, and modern ships now utilize a wide variety of telecom equipment. The individual cabling for each of these pieces of equipment are complex, rapidly increasing the installation and maintenance costs. A new integrated interface system based on the TMS has been proposed to efficiently manage the complex and diverse telecom systems used in these ships. This TMS includes a TIU, which is used to converge various types of data generated from various telecom equipments into one unified type of data. We used QualNet, a representative network simulator, to evaluate the performance of TMS-based network interfaces. We have modelled the existing ship network environment (including the TIU and TMS) on QualNet, and then measured the overall ship network performance in terms of delay time between terminators, and network throughput.
Keywords:
Telecom system, TMS, TIU, Integrated interface system, QualNet, Network simulator키워드:
텔레콤 시스템, TMS, TIU, 통합 인터페이스 시스템, QualNet, 네트워크 시뮬레이터1. 서 론
오늘날 선박 시스템이 지속적으로 증가하고 있다. 그 중 통신 시스템은 해상의 선박과 육상 간의 정보 교환과 관리 방법에 대한 기술 개발로 더욱 많이 증가하고 있다. 과거의 선박에 대한 통신 시스템은 인터페이스를 통해 데이터 공유를 통합하지 않았다. 선박에 디지털이 적용되면서 통신 시스템이 데이터를 공유하기 시작했다. 선박 내의 모든 데이터는 통신 시스템에 전달되고 제어 시스템을 통해 제어된다. 선박 관리의 범위가 통신 시스템의 구성 방식에 따라 결정되기 때문에 통신 시스템은 선박의 성능을 결정하는 중요한 요인이 될 것이다[1]. 텔레콤 시스템을 선박에 설치하기 위해서는 선급(Classification)으로부터 인증을 받아야 한다. 하지만 인증 과정이 복잡하고 많은 비용이 필요하기 때문에 선박을 위한 새로운 기술을 개발하고 적용하는 것은 어렵다. 그리고 선박의 정보통신기술은 기존 텔레콤 시스템들과 호환을 고려하지 않고 있기 때문에 새로운 시스템은 케이블과 데이터 변환을 위한 장비를 추가 설치해야 한다[2][3]. 그리고 최근에 건설된 선박 및 해양 플랜트는 과거에 비해 구조가 복잡해졌고 크기도 매우 커졌다. 이에 따라 선박 내의 텔레콤 시스템들의 종류가 다양해졌고, 배치되는 통신 장비들의 수도 증가하였다. 반대로 선박 내의 텔레콤 시스템들을 관리하는 인원은 줄어들고 있다. 적은 수의 인원으로 시스템들을 효율적으로 관리하기 위해서 선박 내의 통신 서브시스템을 통합적으로 제어할 수 있는 TMS (Telecommunication Management System)와 같은 관리 시스템이 필요하다. 결과적으로 선박 및 해양플랜트의 통신 서브시스템이 앞으로 더욱 중요해짐에 따라 TMS의 필요성도 커지고 있다. 하지만 TMS를 배치하기 위해서 막대한 비용이 필요하고, TMS 자체의 표준화의 부재 또는 불완전성으로 인해 반복적으로 발생하는 요소들로 인해 설치가 어렵다[4][5]. 선박 내의 텔레콤 시스템에서 발생한 다양한 유형의 데이터를 하나의 데이터 유형으로 변환한 후 TMS 서버로 전송하기 위해서 TIU (Telecommunication Interface Unit)을 이용한다. TIU는 다양한 유형의 데이터를 TMS 서버로 전송하기 위해 하나의 유형으로 변환시키는 매우 중요한 역할을 한다.
따라서 본 논문에서는 대표적인 네트워크 시뮬레이터인 SCALABLE NETWORK 사의 QualNet을 이용하여 기존 선박통신망에서 TMS의 성능을 평가한다. 성능은 가장 중요한 종단 간의 지연시간과 처리율에 대해 평가한다. 종단 간의 지연시간은 선박 내의 텔레콤 시스템부터 TIU, TMS 서버, 클라이언트, 그리고 모니터까지 각각 데이터 전송에 소요된 시간을 측정한다.
2. 네트워크 시뮬레이터 QualNet
QualNet 통신 시뮬레이션 플랫폼은 실제 통신 네트워크의 동작을 “모방”하는 계획, 테스트 및 교육도구로 사용된다. 사용자는 네트워크의 기본 동작을 평가하고 작동하기 쉬운 네트워크 기능의 조합을 테스트할 수 있다. QualNet은 시나리오를 기반으로 한 통신 시뮬레이터이다. 따라서 시뮬레이션을 실행하기 위해서는 테스트 환경에 적절한 시나리오를 만들어야한다. QualNet Architect를 통해 시나리오에 사용자가 임의로 노드를 위치시키고 각 노드의 환경을 설정한다. 이후 각 노드에서 발생하는 이벤트와 이벤트가 발생하는 시간을 설정한다. 만들어진 시나리오의 시뮬레이션을 통해 네트워크의 동작과정을 확인할 수 있다. 시뮬레이션이 실행되면 우선 시나리오의 모든 노드는 초기화 과정을 시행하고 대기 상태를 유지한다. 이후 사전에 설정된 시간에 발생한 이벤트에 대한 동작을 처리한다. 모든 이벤트에 대한 동작을 처리한 후, 시뮬레이션 종료 직전에 각 노드의 각 계층별로 통계 자료를 저장한다. 시뮬레이션이 종료되면 저장된 통계 자료들을 이용하여 시뮬레이션 동안 진행된 결과를 분석할 수 있다[6].
3. QualNet 시뮬레이터를 이용하여 구축된 선박통신망 성능 실험
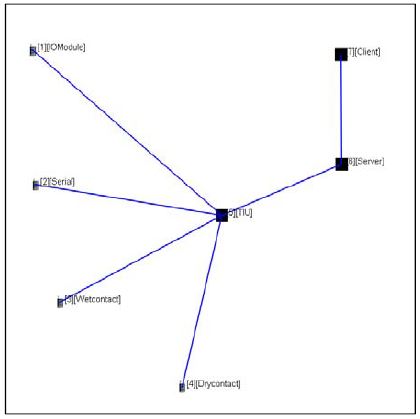
선박 내의 텔레콤 시스템은 매우 다양하다. 각 텔레콤 시스템에서 발생되는 데이터 유형 또한 다양하다. 다양한 데이터 유형 중 기존 인터페이스에 주로 사용되는 데이터 유형인 I/O Module, Serial, Wet contact, Dry contact를 이용하여 성능을 평가한다. 데이터 유형의 정의는 아래 Table 1과 같이 정의된다. 데이터들은 TIU에서 이더넷의 TCP/IP 유형으로 변환하여 TMS 서버로 전송한다. Figure 1은 QualNet GUI로 표현된 선박통신망 토폴로지를 보여준다. Figure 1의 노드 1~4는 데이터가 발생하는 노드인 I/O Module, Serial, Wet contact, Dry contact를 각각 나타낸다. 노드 5는 각 데이터 발생 노드로부터 데이터를 수신하여 이더넷 프레임으로 변환하는 역할을 하는 TIU이다. 노드 6은 TIU에서 변환된 이더넷 프레임을 수신하여 처리하는 TMS 서버를 보여준다. 노드 7은 최종적으로 사용자가 모니터링할 수 있는 클라이언트이다.
시뮬레이션 기간은 1일로 설정하였고 각 노드에서 데이터는 1~5초 사이의 무작위한 간격으로 생성된다. 각 데이터의 크기는 5KB로 동일하다. Figure 1의 노드들에 대한 시뮬레이션 설정은 아래 Table 2를 통해 확인할 수 있다.
패킷 생성 시간은 각 데이터 발생 노드에 연결된 장비로부터 알람 등의 이벤트가 발생하여 실제 각 발생 노드에서 패킷으로 만들어져 전송되기 직전까지 소요되는 시간을 의미한다. 그리고 패킷 변환 시간은 각 데이터 발생 노드로부터 패킷을 수신한 후, 해당 패킷을 이더넷 프레임으로 변화한 후 TMS 서버로 전송되기 직전까지 소요되는 시간을 의미한다. 우리는 실험에서 패킷 생성 시간과 패킷 변환 시간을 동일하게 설정하였다.
이 시간은 각 데이터 유형별로 다르고 항상 소요되는 시간이 일정하지 않기 때문에 각 데이터 유형의 평균 소요 시간에 ±20% 범위의 무작위한 소요 시간을 이용하였다. Table 3을 통해 패킷 생성 시간과 패킷 변환 시간을 확인할 수 있다.
QualNet의 각 노드는 ISO에서 표준화된 네트워크 구조를 제시한 기본 모델인 OSI 7계층을 포함하고 있다. 선박 내의 텔레콤 시스템은 발생된 신호를 전송하기 때문에 OSI 7계층의 물리계층만을 이용해야 하지만 Figure 1의 노드들은 물리 계층뿐만 아니라 상위 계층을 모두 포함하고 있다. 따라서 데이터 생성이 응용 계층에서 생성된 경우와 물리 계층에서 생성된 경우에 대해 각각 실험하였다. 응용 계층에서 생성된 데이터는 응용 계층에서 물리 계층까지 전달되는데 소요되는 시간으로써 Table 3의 패킷 생성 시간이 적용되지만, 물리 계층에서 생성된 데이터는 패킷 생성 시간이 적용되지 않는다. 그리고 패킷 변환 시간은 TIU에서 소요되는 시간이므로 두 경우 모두 적용된다.
4. 시뮬레이션 성능 평가 결과
TIU에 의해 TCP/IP로 변환되어 전송되는 경우와 기존의 선박통신체계를 유지하여 전송되는 경우의 데이터 전송을 포함한 평균 처리시간을 상호 비교한 연구[2]에 의하면 TCP/IP로 통합 변환하는 경우는 94.68 ms이고, 그렇지 않은 경우 (아날로그 전송 포함)는 145.41 ms이다. 약 35% 시간이 감소됨을 알 수 있다. 이 연구 결과를 용인하면서 더욱세밀하게 데이터 전송의 각 지점 (전송 노드 지점과 프로토콜 계층)에서의 전송 성능을 평가하여 TMS 환경에서의 성능개선 효과를 구체화하였다.
성능은 전송 지연 시간과 처리율에 대해 평가한다. 전송 지연 시간은 각 데이터 발생 노드 (source)에서 발생한 데이터가 TIU까지, TMS 서버까지, 클라이언트까지, 그리고 클라이언트 노드의 모니터링 시스템까지 전송되는데 소요된 시간을 의미한다. Table 4는 시뮬레이션 동안 각 데이터 발생 노드에서 생성된 데이터 개수를 보여준다.
4.1 전송 지연 시간
각 데이터 발생 노드의 응용 계층에서 데이터가 발생한 경우에는 Table 3의 패킷 생성 시간이 적용된다. 아래 Table 5는 시뮬레이션 동안 각 데이터 발생 노드의 평균 패킷 생성 시간을 보여준다.
Table 6은 시뮬레이션 동안 각 데이터 발생 노드의 응용 계층에서 발생된 데이터가 각 지점까지 전달되는데 소요된 시간의 평균값을 보여준다. 예를 들어, I/O Module의 데이터가 발생하여 TIU까지의 평균 전송 지연 시간은 약 62.7ms이고, Monitor까지는 약 301.1ms의 시간이 소요된다. 그리고 Figure 2 ~ 5는 Table 6의 데이터를 이용하여 각 데이터 유형별로 각 지점까지의 평균 전송 지연 시간을 각각 표현한 그래프이다.

Assuming that data is generated in the application layer, the average transmission time from each source to each destination
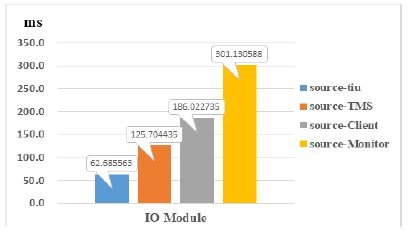
Assuming that data is generated in the application layer, the average transmission time from the I/O Module to each destination
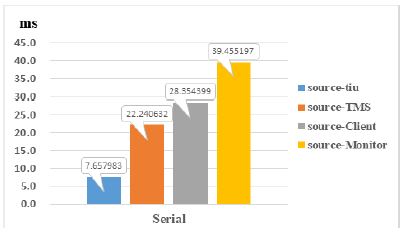
Assuming that data is generated in the application layer, the average transmission time from the serial module to each destination
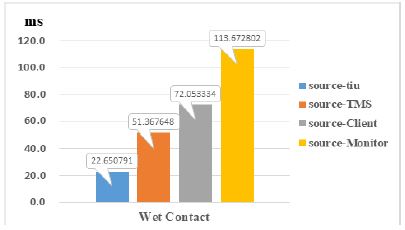
Assuming that data is generated in the application layer, the average transmission time from the wet contact to each destination
각 데이터 발생 노드의 물리 계층에서 데이터가 발생한 경우에는 Table 3의 패킷 생성 시간이 적용되지 않는다. 이 경우, 응용 계층에서 물리 계층으로 전달되는데 소요되는 시간인 패킷 생성 시간이 적용되지 않았기 때문에 각 데이터 발생 노드에서 TIU까지 소요된 평균 지연 시간은 약 2.66ms로 동일하다. Table 7은 시뮬레이션 동안 각 데이터 발생 노드의 물리 계층에서 발생된 데이터가 각 지점까지 전달되는데 소요된 시간의 평균값을 보여준다.

Assuming that data is generated in the physical layer, the average transmission time from each source to each destination
Figure 6 ~ 9는 Table 7의 데이터를 이용하여 각 데이터 유형별로 각 지점까지의 평균 전송 지연 시간을 각각 표현한 그래프이다.
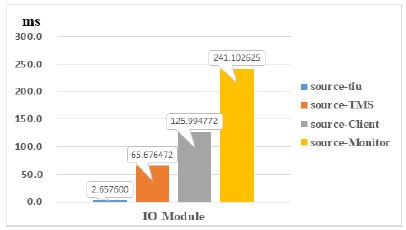
Assuming that data is generated in the physical layer, the average transmission time from the I/O Module to each destination
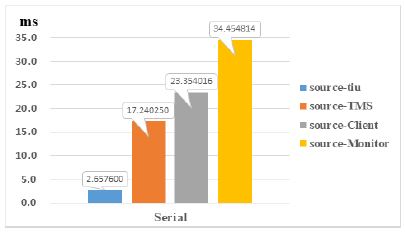
Assuming that data is generated in the physical layer, the average transmission time from the serial to each destination
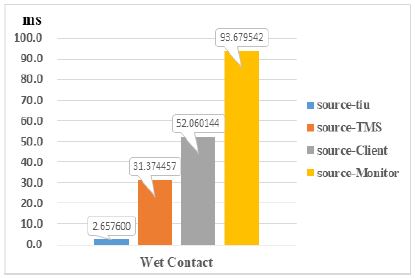
Assuming that data is generated in the physical layer, the average transmission time from the wet contact to each destination
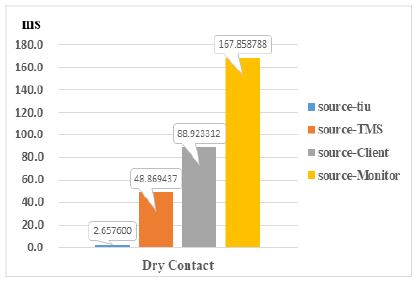
Assuming that data is generated in the physical layer, the average transmission time from the dry contact to each destination
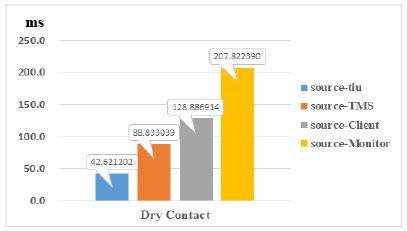
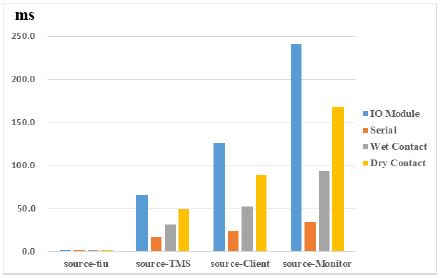
Figure 10과 Figure 11은 응용 계층과 물리 계층에서 데이터가 발생한 경우에 I/O Module, Serial, Wet contact, Dry contact의 데이터가 각 지점까지 전달되는데 소요된 시간을 종합하여 각각 나타낸 그래프를 보여준다.
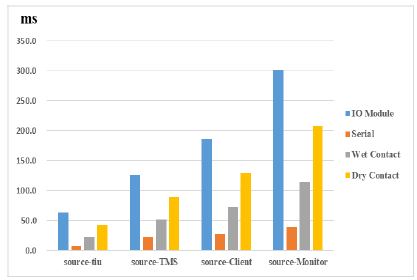
Assuming that data is generated in the application layer, the average transmission time from each source to each destination
4.2 각 데이터 발생 노드의 전송률
아래의 Table 8은 시뮬레이션 동안 각 데이터 발생 노드의 전송률을 보여준다.
실질적으로 각 데이터 발생 노드와 TIU 사이의 통신 링크는 단순 전기 신호만을 전달하기 때문에 각 데이터 발생 노드에서 데이터 신호(아날로그 또는 디지털)형태로 발생되는 곳을 통신 프로토콜 계층의 물리 계층으로 간주하는 것이 더 현실적이다. 따라서 데이터 발생이 물리 계층이라고 간주했을 때, I/O Module, Serial, Wet contact, Dry contact의 각 데이터 신호가 Monitor까지 도달하는데 소요되는 평균 전송 지연 시간은 각각 약 241ms, 34ms, 93ms, 167ms이다. 각 데이터의 평균 전송 지연시간이 차이를 보이는 이유는 각 데이터 발생 노드로부터 단순 전기 신호를 수신한 TIU가 TMS 서버로 보내기 위해 이더넷 프레임으로 변환하는데 소요되는 시간인 패킷 변환 시간 때문이다. 각 데이터는 시뮬레이션 기간인 1일 동안 약 28,000개 이상의 데이터가 발생하여 전송하였고, 이에 대한 전송률은 약 13Kbps를 보인다.
5. 결 론
향후 더욱 복잡하고 다양한 통신 시스템의 배치가 선박 및 해양 플랜트에서 의무화될 것이다. 그러나 통신 시스템은 현재 더 많은 기능을 제공할 수 있지만 단순한 통신 도구로 취급된다. IMO의 규정 및 선박 분류로 인해 오늘날의 선박 및 해양 플랜트에 통신 시스템을 적용하는데 많은 제한이 따른다. 과거에 비해 선박 및 해양 플랜트 구조는 더욱 복잡해지고 선박 크기는 계속해서 커진다. 따라서 통신 시스템을 위한 관리 시스템의 필요성은 점점 더 커지고 있다. TMS는 선박 및 해양 플랜트를 관리하는 데 필수적인 시스템 중 하나가 되어야만 한다.
결과적으로 미래에 IMO 규정 및 선박 분류가 TMS뿐만 아니라 선박 및 해양 플랜트용으로 개발되는 다양한 기술에 대한 통신 시스템 프로토콜 및 데이터를 표준화하기 위한 노력이 필요하다.
References
- J. W. Kim, J. Y. Son, and K. K. Yoon, “An implementation of integrated interfaces for telecom systems and TMS in vessels”, International Journal of Engineering and Technology (IJET), To be appeared.
-
J. W. Kim, J. Y. Son, and K. K. Yoon, “Design of integrated interfaces for telecom systems in vessels based on the TMS”, Journal of the Korean Society of Marine Engineering, vol. 41(no. 6), p583-589, (2017), (in Korean).
[https://doi.org/10.5916/jkosme.2017.41.6.583]

- J. W. Kim, J. Y. Son, and K. K. Yoon, “A study on coverage study of UHF system for standardization of TMS in ships (Abstract)”, Proceedings on International Conference on Computer and Digital Manufacturing 2017 (ICCDM 2017), no. 8, p46-47, (2017).
- J. W. Kim, J. Y. Son, and K. K. Yoon, “Improvement of the TMS deployment methods on ships and offshore plants”, International Journal of Applied Engineering Research (IJAER), vol. 11(no. 24), p11901-11907, (2016).
- J. W. Kim, J. Y. Son, and K. K. Yoon, “An implementation of integrated interfaces for telecom systems and TMS in vessels”, Proceedings on International Conference on Coastal and Ocean Engineering 2017 (ICCOE 2017), p34-36, (2017).
- QualNet, http://web.scalable-networks.com/qualnet-network-simulator-software Accessed December 7, 2017.

