Welding and weaving speed estimation using acceleration sensor based on SVM
Copyright © The Korean Society of Marine Engineering
This is an Open Access article distributed under the terms of the Creative Commons Attribution Non-Commercial License (http://creativecommons.org/licenses/by-nc/3.0), which permits unrestricted non-commercial use, distribution, and reproduction in any medium, provided the original work is properly cited.
Abstract
The amount of heat applied to the welding part by the movement of the welding torch has a predetermined standard per unit area, according to the base material and the welding method. When the heat input is large, the cooling rate is slowed and the ductility is increased; however, as the hardness is decreased, the welding part is easily deformed by the residual stress. Further, if the amount of heat input is small, the weld zone tends to separate due to the lack of welding. Therefore, for a constant amount of heat to be applied to the weld, it is essential to measure the real-time moving speed, direction, and angle of the torch during welding. In this paper, we propose welding and weaving speed estimation system using an acceleration sensor based on the support vector machine (SVM). To measure the welding and weaving speeds, we analyze the obtained signal from the acceleration sensor in the frequency domain, based on the fast Fourier transform (FFT), and derive the feature vector. Based on this, we apply the SVM to improve the accuracy of low speed measurement by classifying the characteristics of the measurement signal according to the speed change. To verify the validity, we analyze the accuracy and error of the proposed algorithm according to the change in welding and weaving speed. The simulation result shows that the proposed method achieves an average positioning accuracy of 93.36% and a maximum positioning error of 0.3834 m.
Keywords:
Welding, Weaving, Support vector machine, Feature vector, Fast Fourier Transform1. Introduction
Welding is inevitably accompanied by problems caused by welding deformation, residual stress, and deterioration of welds due to rapid heating and quenching [1]. To identify and reduce the causes of welding deformation and residual stresses occurring during welding, it is important to analyze the temperature distribution and heat input of the weld zone more easily in real time. In particular, since the welding deformation reduces the dimensional accuracy of the product and incurs additional costs owing to the deformation correction, the amount of heat applied to the welding portion must be constant to prevent welding deformation.
Numerical methods, such as finite difference [2] and finite element [3][4], and experimental approaches using thermocouples [5] and infrared radiation [6][7] are widely used for temperature distribution analysis of welds.
Infrared thermography [8] using a camera is a technology that allows the user to view the surface state of an object as a temperature distribution image using infrared rays emitted from the surface of the object, and the diagnosis result can be quickly confirmed visually. However, since the price of the measuring equipment required for the welding process is high and the equipment is frequently damaged because of the temperature, it is not actively used. Therefore, to apply infrared thermography to the temperature measurement of the weld, it is necessary to study the technique for measuring the temperature effectively while protecting the device.
The heat input measurement method using current measurement is a calculation method using the correlation between the amount of current and the amount of heat input, and it is the simplest measurement method using a sensor. However, the heat input factors, such as the distance between the welder and the base material, and between the welder and the welding angle, are not taken into consideration. Further, as the average input heat amount is calculated by the manual input of the base material length and the welding time, the heat input amount has a large error.
An acceleration-sensor-based speed measurement basically uses integration; therefore, the cumulative error occurs rapidly in proportion to the operating time even with minute measurement errors. The heuristic scale regulation (HSR) is often used as a representative method to solve this problem. The HSR algorithm uses a scale factor to weigh the subsequent values according to the measured values. However, it is difficult to measure in the low-speed state because it removes not only the cumulative error but also the actual speed change in the low-speed case where the cumulative error is removed and the stabilized state is shown.
Therefore, this paper proposes an SVM-based low-speed measurement algorithm using an acceleration sensor, for realtime welding and weaving speed measurements. To measure the welding and weaving speeds, we analyze the obtained signal from the acceleration sensor in the frequency domain and derive the feature vector. Based on this, we apply the SVM to improve the accuracy of low speed measurement by classifying the characteristics of the measurement signal according to the speed change. To verify the validity, we analyze the accuracy and error of the proposed algorithm according to the change of welding speed and weaving speed.
2. Related Theory
2.1 Welding Heat Input
The amount of heat input to the weld is the amount of heat supplied to the weld during welding, expressed in units of J/cm2, for every 1 cm of weld bead. During welding, heat is generated from the welding arc or from metal migration, chemical energy is generated from the coating or the fusion part of the welding rod, and so on. However, most heat is generated by the welding arc, and its value is given by
| (1) |
where E is the voltage, I is the current and v is the speed. As the heat input increases, the cooling rate becomes lower and the ductility increases, but the hardness value decreases and the residual stress increases, which will likely cause deformation. Further, as the heat input amount is reduced, martensite is generated, the hardness value is increased, the brittleness is increased, and insufficient welding becomes a concern. Therefore, the measurement of welding speed as well as voltage and current are also important factors. However, in the conventional welding speed measurement, the average speed is calculated by measuring the welding time by inputting the length of the base material. As a result, problems arise because of the inability to distinguish the sections where the speed increases or decreases.
2.2 Fast Fourier Transform
An efficient algorithm for computing Discrete Fourier Transforms (DFT) is called Fast Fourier Transform. The DFT is expressed as
| (2) |
where is an arbitrary signal and is assumed to be discrete and periodic. O (N2) multiplication and addition are required to compute the DFT for the N-point sequence using the DFT. The most commonly used FFT algorithm is a Cooley-Tukey algorithm, which uses a partitioning-reduction algorithm. It recursively divides the DFT of size n and combines the results. It can compute the same DFT in only O(N log N) operations.
2.3 Support Vector Machine
The SVM is a supervised learning method based on a structural risk minimization method that minimizes the probability of misclassifying data with fixed but unknown probability distributions. This is accomplished by creating a hyperplane that optimally separates the data samples while minimizing the maximum classification margins and the empirical error between the two classes. The SVM transforms the input space data, which is widely used in binary classification problems and is difficult to be linearly separated into a high-dimensional feature space using a nonlinear mapping function to create a linear hyperplane. To create a nonlinear classification boundary, one side is divided into the +1 class, and the other side is divided into the -1 class based on the hyperplane. The optimal hyperplane for classifying the two classes should maximize the distance between the data closest to the hyperplane separating each classification data and is defined as
| (3) |
is one point on the hyperplane, is the normal, and b is the deflection. If the data are linearly separable, the hyperplane defining the two classifications is represented by
| (4) |
Since the two hyperplanes must maximize the margin between the two planes, the objective equation that has Equation (4) as a constraint is expressed as
| (5) |
Finally, given an arbitrary input pattern x , the discriminant function is given by
| (6) |
where αi is the Lagrange multiplier and K is the kernel function.
3. Proposed Algorithm
3.1 Proposed welding speed estimation system
The proposed overall welding speed measurement system is shown in Figure 1. To extract the exact feature vector by welding speed and weaving, we collected the signals of the acceleration sensor generated at the constant speed motion using the auto-carriage, which can automatically weld in a simple circulation environment. The frequency spectrum extracted by the FFT analysis is used as an input feature vector of the SVM classifier. When moving the welding torch, the speed is low enough to warrant the use of the units cm/min. The received acceleration signal has different amplitudes and periods depending on the movement and weaving speed. To measure the moving speed, We constructed dataset with 0-40 rpm/min weaving motion and 0-50 cm/min linear motion on x and y axes using an auto-carriage that can move at a constant speed.
3.2 Acceleration Signal Analysis
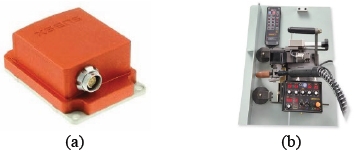
To verify the performance of the proposed algorithm, we used the acceleration sensor and auto-carriage, as shown in Figure 2. The acceleration sensor module is MTi-30 AHRS from Xsens, and the auto-carriage is modeled by CS-51WE from KOWELD. The specifications of the acceleration sensor and auto-carriage are shown in Table 1 and Table 2, respectively.
The acceleration measured by the acceleration sensor includes various types of accelerations, such as gravitational acceleration and the acceleration that occurs when the magnitude or direction of the speed changes. These properties can be expressed as
| (7) |
where u, v, and w represent the moving speed; p, q, and r indicate the respective rotational angular velocities. Further, g is the gravitational acceleration. The acceleration sensor should perform constant-speed motion and the value should be determined by θ and φ when the posture is unchanged.
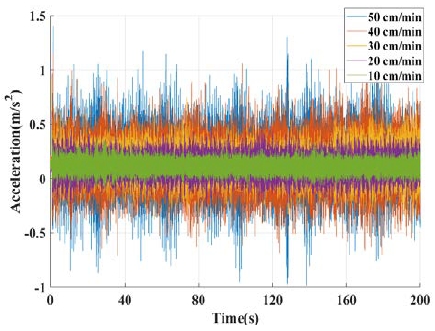
Figure 3 shows the result of acceleration measurement when the acceleration sensor is attached to the auto-carriage, and the constant speed motion is set between 10 cm/min and 50 cm/min. Table 3 shows the average acceleration sensor values according to the moving speed. It was confirmed that the acceleration sensor increased in the case of constant speed motion, and it was larger by 0.0044 m/s2 at 10 cm/min and 20 cm/min. When the size of the acceleration sensor in the time domain is used, errors occurred in the speed measurement, and the feature vector was not displayed well.
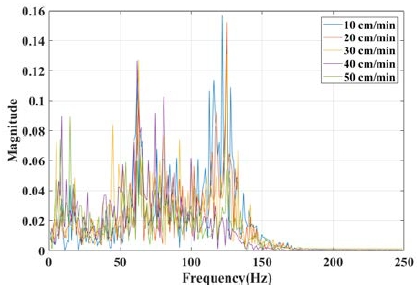
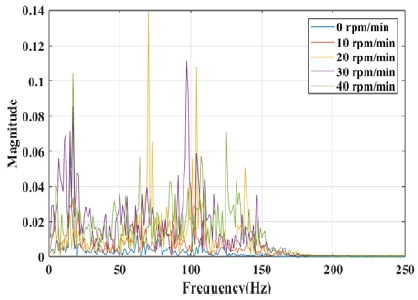
Figure 4 shows the magnitude according to the angular speed in the frequency domain. Using FFT, we have confirmed that the feature vectors are classified by each class in the time domain. The sampling time is 1 second and the sampling frequency is 250 Hz. As a result of frequency spectrum analysis using FFT, it is confirmed that the feature vector is clarified according to each movement speed.
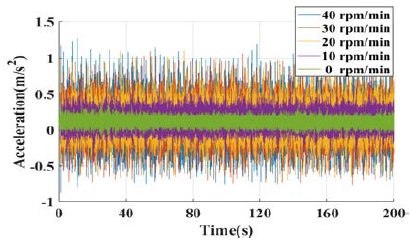
Figure 5 shows the result of measuring acceleration with an acceleration sensor attached to an auto-carriage at a constant speed of 10 cm/min, and 0 rpm/min to 40 rpm/min of weaving motion. The acceleration magnitude was confirmed to be higher than the constant speed motion owing to the angular speed of the acceleration sensor. Figure 6 shows that the feature vector became clearer when the speed was different. Both Figure 4 and Figure 6 had a small value beyond 200 Hz.
4. Experiment Result
The feature vector was used as a database. For the test and learning, 50% of the feature vectors extracted using two-fold cross-validation were divided into 50% test data as learning data. In the proposed system, the accuracy according to x and y axes movements and weaving was checked, and the accuracy was detected according to the learning frequency. We compared the performance of the racial bias function (RBF), polynomial, and sigmoid among the commonly used kernel functions. The kernel function is a function that converts the input vector into a higher-order feature vector and then performs the process of finding the inner product. Table 4 shows the accuracy of the classification obtained by checking the weaving speeds of the x-axis and y-axis by the kernel function. The accuracy of the speed was 90.16% minimum and 97.03% maximum, respectively, and the overall accuracy was 93.36%. Among the three functions, the RBF showed the best accuracy.
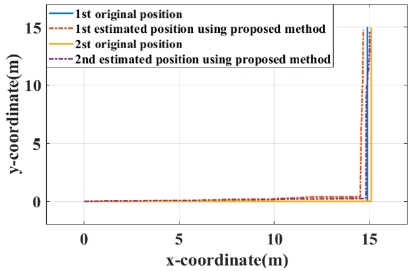
Figure 7 shows the result of position measurement using the proposed algorithm. The mean square error value was 0.3184 m for the first and 0.2264 m for the second. Considering the general length of the welding, it showed a very high accuracy. The error of the last point was 0.3271 m in the first and 0.3834 m in the second. It was confirmed that the cumulative error was eliminated.
5. Conclusion
In this paper, we proposed the measurement method of welding and weaving speeds using an acceleration sensor based on an SVM and FFT. We have confirmed the possibility of classifying the moving speed and weaving speed by complementing the disadvantages of the HSR-algorithm-based speed measurement system using an acceleration sensor and heat input measurement using a current thermal camera and current. In the future, it will be possible to monitor the heat input in real time and to identify welding faults, to facilitate quick response and warning measures. The future task of this study is to establish a database of skilled welders and to build a 3D speed measurement system along with the noise removal of the acceleration sensor.
Acknowledgments
This research was supported by Basic Science Research Program through the National Research Foundation of Korea(NRF) funded by the Ministry of Education(NO.2016R1 D1A1B03934812).
References
-
J. Goldak, A. Chakravarti, and M. Bibby, “A new finite element model for welding heat sources”, Metallurgical and Materials Transactions B, vol. 15(no. 2), p299-305, (1984).
[https://doi.org/10.1007/BF02667333]

- Y. S. Kim, “New welding technology for innovation of the marine equipment industry”, Proceedings of the Korean Society of Marine Engineering 2010 Second Conference, p313-315, (2010), (in Korean).
-
S. I. Song, S. W. Ahn, Y. G. Kim, and H. G. Kim, “Development of simplified finite element models for welded joints”, The Transactions of the Korean Society of Mechanical Engineers A, vol. 39(no. 11), p1191-1198, (2015), (in Korean).
[https://doi.org/10.3795/KSME-A.2015.39.11.1191]

- C. W. Lee, Finite Element Analysis of Fillet Weld Design Analysis, M.S. Dissertation, Department of Mechanical Engineering, Kyungpook National University, Korea, (2014), (in Korean).
- H. C. Kwon, S. K. Park, and H. S. Chang, “Spot welding of thermocouple using servo micro spot welder”, Proceedings of the Korean Welding and Joining Society Conference, p333-335, (2004), (in Korean).
- S. B. Park, J. T. Oh, and Y. K. Ju, “Non-destructive measurement technique of welding using infrared thermography technique”, Journal of the Architecture of Korea Structure and Construction, vol. 33(no. 11), p3-10, (2017), (in Korean).
- W. T. Kim, “Infrared thermographic experimental analysis for fatigue life prediction of welded joint”, Journal of the Korean Society for Nondestructive Testing, vol. 35(no. 3), p221-224, (2015), (in Korean).
-
C. S. Ro, K. S. Kim, and H. S. Chang, “Method for measuring weld temperature using an infrared thermal imaging camera”, Journal of the Korean Society for Nondestructive Testing, vol. 34(no. 4), p299-304, (2014), (in Korean).
[https://doi.org/10.7779/JKSNT.2014.34.4.299]


