In situ measurement of shortwave radiation by ship for harvesting sea solar energy
Copyright © The Korean Society of Marine Engineering
This is an Open Access article distributed under the terms of the Creative Commons Attribution Non-Commercial License (http://creativecommons.org/licenses/by-nc/3.0), which permits unrestricted non-commercial use, distribution, and reproduction in any medium, provided the original work is properly cited.
Abstract
This paper presents in situ measurement results for global horizontal radiation to obtain precise information about incoming shortwave radiation along a ship’s route between Tongyeong (South Korea) and Hakata (Japan). The observations were performed on a volunteer ship during the spring, summer, and fall seasons of South Korea in 2016. The observed data were compared with NASA-SSE data from 2004 and classified as maximum, minimum, and average values based on whether the weather was fine, cloudy, or rainy, respectively. A computational analysis of the collected data was also performed. The average global horizontal radiation observed in 2016 in this experiment was approximately 1kWh/m2/day less than that found in 2004. The statistical analysis showed that there were both overestimations and underestimations in our measurements. The maximum root mean square error was 3.2kWh/m2.The weather condition and month of the year have significant effects on a mobile coastal solar radiation power plant. Finally, we assumed that a 1630 mm × 982 mm mono-crystalline silicon solar module was installed on the roof of the ship, and the energy in kilowatt hours per day was calculated. In this case, the highest possible value when harvesting solar energy was 76.39kWh/day and the lowest was 39.47kWh/day. Approximately 73.59kWh/day could be obtained on average using this solar module from April to August. However, this value is reduced by approximately half during the fall season.
Keywords:
Root mean square error (RMSE), Ocean, Shortwave, Solar energy1. Introduction
The energy derived from oil, gas, and coal has played a vital role in meeting our energy demands until now. Because of the shortage of these energy sources, it is essential to ultimately transition to alternative sources. This is why, during the last two decades, both developing and developed countries have been focusing much attention on the harvesting of renewable energy. In addition to technological developments, the personal and psychological factors affecting the successful development of renewable energy in many countries like Yemen [1] and Nigeria [2] have been examined. Various researchers have stated that even though people in both urban and rural areas are not fully aware and informed about renewable energy, they have high positive expectations for its use. Many researchers also investigated the effect of renewable energy consumption on economic growth. For example, A. Alper et al. [3] reported that renewable energy has positive impacts on economic growth for all the selected EU member countries, and especially Bulgaria, Estonia, Poland, and Slovenia.
Many researchers have analyzed the five most significant emerging alternative energy sources (solar, wind, geothermal, biofuels, and biomass). For example, Hussain et al. [4] explained each emerging renewable source, along with its market share, challenges, and implications for increased adoption, future prospects, and drawbacks. Moreover, only the use of renewable energy can effectively mitigate the unfavorable climate change [5][6]. Among these five emerging alternative energy sources, solar energy is recognized as the number one renewable energy source because of its utility, greater cleanliness, and reduced operating costs. More than 50% of the solar radiation irradiance at the top of the atmosphere reaches earth’s surface. Currently, numerous studies on the use of photovoltaic cells and solar hot water systems in homes, factories, and schools are being performed to fulfill our daily life energy demands [7]-[12] by adding different types of materials to improve the performance of a solar cell [13]-[17]. In addition, some studies have been conducted to optimize the energy storage operation [18].
The ocean covers about 70% of the globe’s surface and more than 90% of the solar radiation at the sea’s surface is absorbed by the ocean. Recently, some investigators have developed algorithms to estimate the downward shortwave radiation flux at the sea’s surface using remote sensing data obtained from satellites. In the near future, such methods may provide precise estimations with very high spatial and temporal resolutions [19]. In addition, there is much research on an offshore grid to connect offshore wind power systems to onshore systems [20], which is absent for solar energy systems. Thus, to develop an estimation method for solar energy to build a new and revolutionary paradigm for a micro-grid [21][22] of offshore solar energy or mobile coastal solar power plants, a large quantity of sea truth data under various atmospheric conditions is needed.
Like D. Palit et al. [23], many researchers [24] believe that grid extension is one of the best sustainable remedies to overcome the energy demand and that harvesting solar energy with the help of a ship in a sea region will be one of the best approaches in the near future. Measuring the amount of solar radiation at sea is the most important factor for the development of this type of solar energy system. The amount of solar radiation is often affected by weather conditions, which are completely different from the factors considered during the measurement of solar irradiance on land. In this study, the amount of solar radiation on the sea was measured along the selected ship’s route by considering global horizontal radiation. We performed direct observations of the downward shortwave radiation at the sea’s surface in the east ocean. This may be the first ever routine attempt to observe the downward shortwave radiation in this selected large ship route area. The downward shortwave radiation at the sea surface is determined by the conditions of the entire atmospheric column through which the solar radiation passes, i.e., the temperature, wind direction, wind speed, calmness, humidity, air pressure, and flight speed. In this paper, we describe the experimental approach in section 2. We analyze the collected data based on the weather (section 3.2), three seasons (section 3.3), individual months (section 3.4), and probable harvested solar energy (section 3.5) to derive accurate and helpful conclusions (section 4).
2. Experiment setup
2.1 Selection of sea area
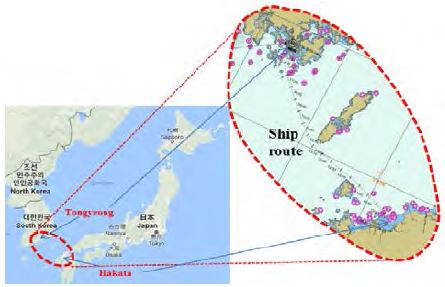
For our study of solar energy harvesting, we considered the solar irradiance, i.e., downward shortwave radiation on the sea area. N. Iwasaka et al. [25] considered in situ measurements of the solar radiation in the western pacific. M. Guadalfajara et al. [26] reported in their paper that the location and different demands corresponding to different climate areas have very significant effects when considering a simple calculation for central solar heating plants with seasonal storage. Therefore, we considered a region of the East Sea between South Korea and Japan over three seasons (spring, summer, and fall),as shown in Figure 1.
Figure 1 shows the observation area between Tongyeong (34:49.91, 128:23.86) and Hakata (33:37.95, 130:19.04). The three reasons for selecting this area are as follows: 1) our volunteer ship route from Tongyeong to Hakata is seldom changed by weather conditions, 2) the latitude difference between these two locations is very small, and 3) the longitude difference is also small.
The first reason allows us to observe the downward shortwave radiation in this wide region under various atmospheric conditions. We avoided the winter season because we could not properly measure the solar irradiance then, and the value was too small to separate the actual value from the error data. Because the temperature changes 1.6 Kelvin (K) for every 482.803 km change in latitude at sea level, the second reason theoretically gives us a temperature difference of 0.33 K (Table 1) between Tongyeong and Hakata, which is very small. This makes it possible to consider the average temperature effect between Tongyeong and Hakata on the solar irradiance, rather than different effects.
In relation to the third reason, there is a small time difference between these two areas, of approximately 8 min (Table 1), because we know that every 15° east or west of Greenwich represents approximately 1 h. As a result, this helps us to more accurately analyze the downward shortwave radiation, i.e. the average global horizontal radiation per day data. Our observation time was limited to the period from April 2016 to November 2016. Table 2 lists the training ship, along with its type and period of observation. It takes the ship approximately 12h to complete one voyage from Tongyeong to Hakata or vice versa.
2.2 Method of data collection
We used a straightforward approach in our experiment, collecting meteorological data and applying the simple linear regression results, mean bias error (MBE), and root mean square error (RMSE)in a statistical analysis. The measurement system consists of a pyranometer, digital data logger, and computer installed on the ship.
A second class pyranometer was used for the experiment under the ISO 9060 classification(EKO INSTRUMENTS CO. LTD).The sensitivity of the sensor is approximately 7.0μV/W/m2 in a wavelength range of 285–3000nm, and the response time is 17 s. The overall specifications of the pyranometer are listed in Table 3. Many researchers have conducted experiments on the leveling of a pyranometer [27]. However, we simply followed the manual provided by EKO INSTRUMENTS CO. LTD. Ourpyranometer was mounted on a structure at the side of the winch room of the ship, which was far enough away from the surrounding obstacles so that the sensing part of the pyranometer could properly receive light from the sun, as shown in Figure 2. Data from the data logger were recorded on the computer at 10 min intervals, and the ambient air temperature was also measured.

Side view of ship’s winch room. The pyranometer was installed on a structure at the side of the ship’s winch room
Because this is an independent instrument, it does not require an electric power supply from the ship. Our selected ship route did not involve the occurrence of large waves, and the ship had a ballast tank, which helped us to collect smooth data.
R. H. Inman et al. [28] showed in their paper that clouds significantly attenuate ground-level solar irradiance, causing a substantial reduction in the photovoltaic power output capacity. Their selected areas were California and Hawaii. Thus, the officers and crew of the ship were asked to wash the glass dome of the pyranometer with fresh water every morning. We also asked them to record the ship’s position with the help of a GPS system during the voyage.
3. Result and discussion
3.1 Reference data
For reference values, we first selected three points on land that are close to the sea within this selected area: Tongyeong (34:49.91,128:23.86), Tushima (34:02.30,129:09.10), and Hakata (33:37.95,130:19.04). Then, the global horizontal radiation data per day in 2004 at these three point swere collected from NASA-SSE. Madanchi et al. [29] showed a strong non-linear and non-stationary measured irradiance time series similar to Figure 3 and Figure 7. However, because of the small latitude and longitude differences among these places, as previously described, the data graphs for these three places differed very slightly. Moreover, this slight fluctuation helped us to obtain the average data for the whole selected region. The data of these three locations were averaged by considering data at the same time for each location. Finally, the data were classified under three seasons: spring, summer, and fall. Figure3 represents a time series of the average global horizontal radiation per day observed during the period from April 1through November 30, 2004.
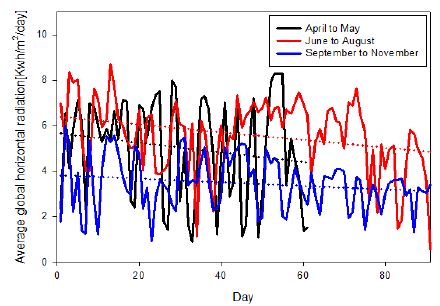
Reference time series of average global horizontal radiation per day observed during period of April 1throughNovember 30, 2004. Data source: NASA-SSEweb site
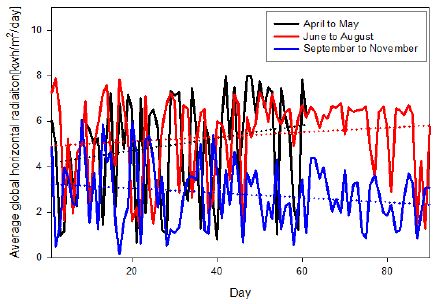
Time series of average global horizontal radiation per day observed during period of April 1through November 30, 2016
As shown in Figure 3, during the spring season, the maximum, minimum, and average values were 5.036kWh/m2/day, 4.979kWh/m2/day, and 5.0075kWh/m2/day, respectively.
Similarly, in the summer of 2004, the maximum, minimum, and average values were 6.964kWh/m2/day,4.816kWh/m2/day, and 5.89kWh/m2/day, respectively. However, in the fall season (2004),from September to November, the maximum, minimum, and average global horizontal radiation values were 4.068kWh/m2/day, 3.327kWh/m2/day, and 3.6975kWh/m2/day, respectively.
3.2Analysis of measured data based on weather condition
Usually, as previously mentioned, it takes approximately 12 h to go from Tongyeong to Hakata and vice versa along the ship route, as shown in Figure 1. After studying our reference (Figure 3), we started collecting per day average isolation data with the help of the pyranometer and our volunteer ship J. Tanesab et al. [30] investigated the contribution of dust to the long-term performance degradation of a photovoltaic module in a temperate climate zone. Their estimated operating time as a long-time performance was eighteen years. In our experiment, the duration was less than one year. Thus, we did not need to consider this factor(dust)while collecting the solar radiation data.
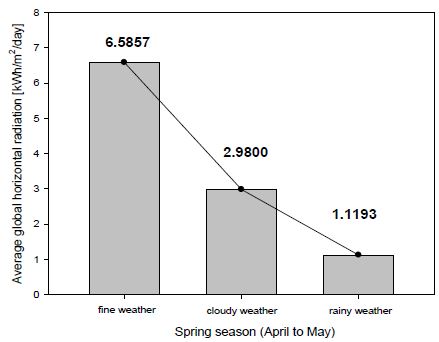
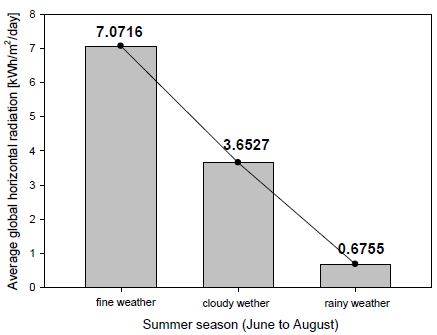
Using our observations, the average global horizontal radiation per day was analyzed under different weather conditions for each of the three seasons. The three bar graphs (Figure 4, Figure 5, and Figure 6) show the average global horizontal radiation per day in kilowatt hours per square meter for the three seasons (spring, summer, and fall). As shown in Figure 4, during fine weather, cloudy weather, and rainy weather, the average insolation values were 6.5857kWh/m2/day, 2.98kWh/m2/day, and 1.1193kWh/m2/day, respectively. Similarly, as shown in Figure 5, these values were 7.0716kWh/m2/day, 3.6527kWh/m2/day, and 0.6755kWh/m2/day, respectively. Finally, as shown in Figure 6, the fall season gave values of 3.6776kWh/m2/day, 1.7752kWh/m2/day, and 0.6640kWh/m2/day for fine weather, cloudy weather, and rainy weather, respectively.
Comparing these three bar graphs, it is obvious that except during rainy weather, it is possible to obtain approximately 1kWh/m2/day more global horizontal radiation during fine and cloudy weather in the summer season than during the other two seasons. However, during rainy weather for all three seasons, there was no significant change in the global horizontal radiation.
3.3Analysis of measured data based on three seasons
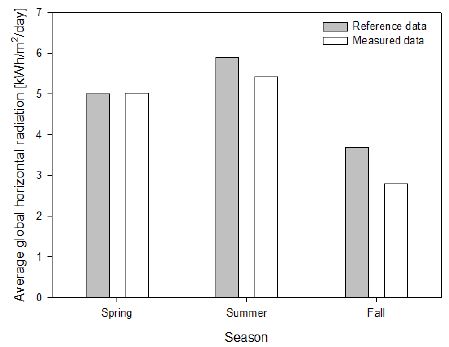
Figure 7 represents the times series of the average global horizontal radiation per day observed during the period from April through November 2016. Although March is included in the spring season, we did not consider this month because severely cold conditions existed during the winter season that ranged from December to mid-March of 2016. Thus, to avoid the error data due to this severe cold, we only considered the data from April to May. In Figure 7, the days are represented along the X axis, with the average insolation per day along the Y axis. The dotted line represents a linear regression that gives the maximum, minimum, and average of the per dayaverage insolation values during the spring season, which are 5.8284kWh/m2/day, 4.2111kWh/m2/day, and 5.0198kWh/m2/day, respectively. Compared to the spring of 2004, i.e., Figure 3, 2016 shows an increase in the average per day insolation of 0.25%. During the summer season of 2016, as shown in Figure 7, the maximum, minimum, and average values of the per day average global horizontal radiation are 5.91871kWh/m2/day, 4.9167kWh/m2/day, and 5.4177kWh/m2/day, respectively. Unlike spring 2016, compared to the summer of 2004, in 2016, the per day average global horizontal radiation decreased by 8.02%. Similarly, compared to the fall season of 2004, the per day average isolation decreased by 24.29%, where the maximum and minimum values were 3.3098kWh/m2/day and 2.2885kWh/m2/day, respectively. For easy understanding, Figure 8 was plotted with the help of the abovementioned maximum, minimum, and average values of both the reference data (2004) and measured data (2016).
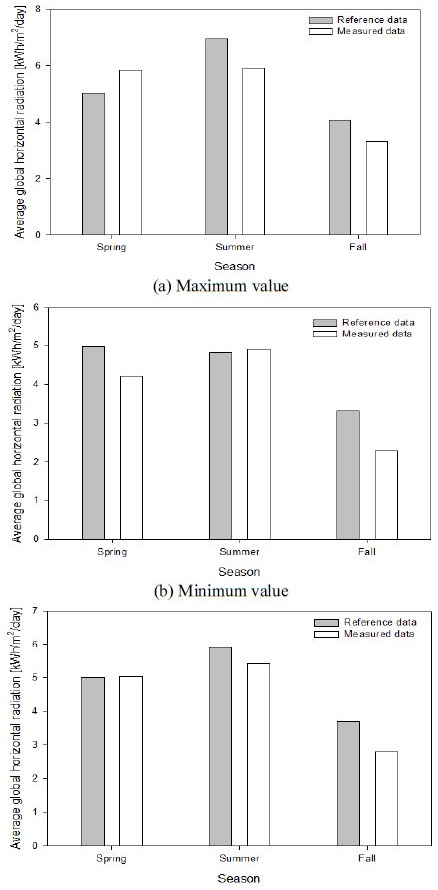
Maximum, minimum and average of per day average global horizontal radiation during spring, summer and fall season, 2016
Thus, when we do not consider the weather conditions, but only the season, and compare with the NASA-SSE (2004) data, we see that except for the spring season, there is a significant difference in the average values. Our measured values are lower than the reference values, with differences between the NASASSE (2004) data and measured data of 8.02% and 24.3% during the summer season and fall season, respectively.
3.4 Analysis of measured data based on individual months
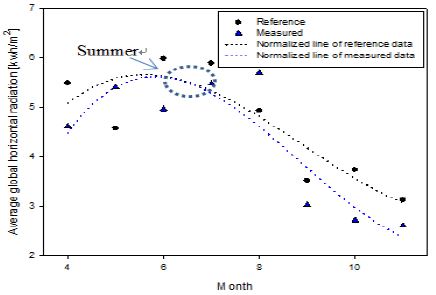
For further analysis, we comparison the NASA-SSE data (2004) and insitu measurement data (2016) for each month. In Figure 9, the blue dotted normalized line for the measured data shows a lower average global horizontal radiation than the NASA-SSE 2004 data. In addition to the normalized curve, the MBEand RMSE are taken into consideration. The necessary equations can be found in another paper [31].
| (1) |
| (2) |
where Hl,m and Hl,c are the lth measured and calculated values, respectively (kWh/m2)
Positive and negative MBE values represent overestimations and underestimations, respectively. Zero MBE and RMSE values are ideal. As listed in Table 4, a statistical analysis based on the MBE and RMSE shows that there are both overestimations and underestimations in our measurements, with a maximum RMSE of3.2kWh/m2.
This time, we did not consider the effect of the weather condition or classify the data according to the season. Instead, when considering the month, it is obvious that unlike in section 3.3, with the exception of the summer season, our measured data were always below the reference data.
3.5 Analysis of measured data based on probable harvested solar energy
It is obvious that the per day average insolation during fine weather was higher than the maximum value obtained by linear regression for the same season. However, the linear regression data were considered to be the nominal values for further analysis. The following equations were used for this purpose:
| (3) |
| (4) |
| (5) |
where, PDAI= per day average insolation (Kwh/m2/day) and PR= performance ratio
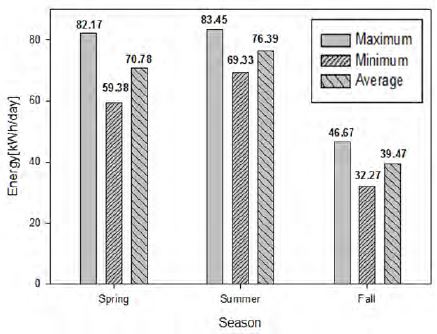
D. Li et al. [32] presented the impact of the estimated solar radiation on a gross primary productivity (GPP) simulation for a subtropical plantation in southeast China. They showed two types of effects: those during the growing season and nongrowing season. In our study, for further analysis, we considered the per day energy based on the above data. Figure 10 shows the energy (kWh/day) during the spring, summer, and fall seasons of 2016 for the selected ship route area. In this regard, a certified solar module producer’s (SAMSUNG ELECTRONICS CO. LTD) solar module was considered. Currently, this company supplies six models: LPC235S, LPC238S, LPC241S, LPC244S, LPC247S, and LPC250S. All these modules are mono-crystalline silicon solar modules having thedimensions1630mm×982mm. The only differences among these six solar modules are their different watt-peak values. LPC235S has the lowest and LPC250S has the highest watt-peak values at235W and 250W, respectively. In our experimental study, LPC2356S was considered and assumed to be mounted on the roof of the volunteer ship during the observation. The area of the solar panel was 1.6007m2. The solar panel yield was 11.75%. The insulation characteristics of a solar photovoltaic cell are important factors because they significantly affect the loss [33]. Thus, to calculate the performance ratio (with a range of 0.5–0.9 and default value = 0.75) we considered various losses, including the inverter losses (8%), temperature losses (8%), DC cable losses (2%), AC cable losses (2%), shading(3%), losses due to weak irradiation (3%), losses due to dust and snow (2%), and other losses (0%). As is well known, there are two types of performance: 1) under standard test conditions (STC) and 2) under the nominal operating cell temperature (NOCT). Under STC, the irradiance is 1000W/m2, AM is 1.5, and cell temperature is 25°C, whereas under the NOTC, the irradiance is 800W/m2. In our calculation, we considered the NOTC instead of the STC to obtain an accurate nominal value rather than the standard value. As shown in Figure 10, the energy values for the three seasons of 2016 were divided into the maximum, minimum, and average values. It is obvious that the summer season demonstrated the highest per day energy in kilowatt hours, with values of 83.45kWh/day, 69.33kWh/day, and 76.39 kWh/day for the maximum, minimum, and average values, respectively. Compared to the summer season, the spring season exhibited 1.53%, 14.35%, and 7.34% less energy (kWh/day)for the maximum, minimum, and average values, respectively. In addition, the energy harvested during the fall season was almost half of the energy obtained during the summer season. Within the three seasons, the highest possible average harvested energy was 76.39kWh/day, whereas the lowest was 39.47kWh/day.
4. Conclusion
A direct measurement of downward shortwave radiation in a sea area located between Tongyeong, South Korea and Hakata, Japan was performed using a pyranometer mounted on the roof of a volunteer ship. When considering a micro-grid extension to utilize sea solar energy, some important information may be considered based on the results of this study:
- (1) When considering weather conditions during the harvesting of solar energy, it is better to choose the summer season because the outcome of the analysis gave 1kWh/m2/day more global horizontal radiation under fine and cloudy weather conditions.
- (2) If the effect of the weather condition is neglected, the spring season is better when estimating the probable harvested solar energy. For the other two seasons, there were significant differences between the NASA-SSE (2004) data and our measured data, which were 8.02% and 24.3% during the summer season and fall season, respectively.
- (3) Unlike the analysis based on the three seasons, the outcome of the analysis based on individual months showed that the months during the summer season were a better time to estimate the probable harvested solar energy because there was no reasonable difference between the NASA-SSE (2004) data and measured data. Thus, the type of analysis approach has a significant effect on decision making when estimating the probable solar energy.
- (4) If a 1630 mm × 982 mm mono-crystalline silicon solar module (model LPC235S)were installed on the roof of the ship, the highest possible value when harvesting solar energy was found to be 76.39kWh/day, while the lowest was 39.47kWh/day.
Acknowledgments
This research was supported by Basic Science Research Program through the National Research Foundation of Korea (NRF) funded by the Ministry of Education (No.2015R1D1A1A01058030). The authors wish to thank SAEBADA of GNU, South Korea for the training ship.
References
- D. Aidroos, H. Abdul, and S. Obaid, “Personal and psychological factors affecting the successful development of solar energy use in Yemen power sector : A case study”, Renewable and Sustainable Energy Reviews, vol. 60, p516-535, (2016).
-
C. G. Ozoegwu, C. A. Mgbemene, and P. A. Ozor, “The status of solar energy integration and policy in Nigeria”, Renewable and Sustainable Energy Reviews, vol. 70, p457-471, (2017).
[https://doi.org/10.1016/j.rser.2016.11.224]

-
A. Alper, and O. Oguz, “The role of renewable energy consumption in economic growth : Evidence from asymmetric causality”, Renewable and Sustainable Energy Reviews, vol. 60, p953-959, (2016).
[https://doi.org/10.1016/j.rser.2016.01.123]

-
A. Hussain, S. M. Arif, and M. Aslam, “Emerging renewable and sustainable energy technologies : State of the art”, Renewable and Sustainable Energy Reviews, vol. 71, p12-28, (2017).
[https://doi.org/10.1016/j.rser.2016.12.033]

-
P. T. I. Lam, and A.O.K. Law, “Crowd funding for renewable and sustainable energy projects : An exploratory case study approach”, Renewable and Sustainable Energy Reviews, vol. 60, p11-20, (2016).
[https://doi.org/10.1016/j.rser.2016.01.046]

-
L. Tripathi, A. K. Mishra, A. Kumar, C. B. Tripathi, and P. Baredar, “Renewable energy: An overview on its contribution in current energy scenario of India”, Renewable and Sustainable Energy Reviews, vol. 60, p226-233, (2016).
[https://doi.org/10.1016/j.rser.2016.01.047]

-
K. Shanks, S. Senthilarasu, and T. K. Mallick, “Optics for concentrating photovoltaics : Trends, limits and opportunities for materials and design”, Renewable and Sustainable Energy Reviews, vol. 60, p394-407, (2016).
[https://doi.org/10.1016/j.rser.2016.01.089]

- J. Faca, “Optimization of flow distribution in flat plate solar thermal collectors with riser and header arrangements”, Solar Energy, vol. 120, p104-112, (2015).
-
D. Sengupta, P. Das, B. Mondal, and K. Mukherjee, “Effects of doping , morphology and film-thickness of photo-anode materials for dye sensitized solar cell application – A review”, Renewable and Sustainable Energy Reviews, vol. 60, p356-376, (2016).
[https://doi.org/10.1016/j.rser.2016.01.104]

-
A. Bai, J. Popp, P. Balogh, Z. Gabnai, B. Pályi, I. Farkas, G. Pintér, and H. Zsiborács, “Technical and economic effects of cooling of monocrystalline photovoltaic modules under Hungarian conditions”, Renewable and Sustainable Energy Reviews, vol. 60, p1086-1099, (2016).
[https://doi.org/10.1016/j.rser.2016.02.003]

-
S. Sharma, B. Siwach, S. K. Ghoshal, and D. Mohan, “Dye sensitized solar cells: From genesis to recent drifts”, Renewable and Sustainable Energy Reviews, vol. 70, p529-537, (2017).
[https://doi.org/10.1016/j.rser.2016.11.136]

-
G. Leonzio, “Solar systems integrated with absorption heat pumps and thermal energy storages: State of art”, Renewable and Sustainable Energy Reviews, vol. 70, p492-505, (2017).
[https://doi.org/10.1016/j.rser.2016.11.117]

-
L. Kornblum, D. P. Fenning, J. Faucher, J. Hwang, A. Boni, M. G. Han, M. D. Morales-Acosta, Y. Zhu, E. I. Altman, M. L. Lee, C. H. Ahn, F. J. Walker, and Y. Shao-Horn, “Solar hydrogen production using epitaxial SrTiO3 on a GaAs photovoltaic†”, Energy Environmental Science, p377-382, (2017).
[https://doi.org/10.1039/c6ee03170f]

- R. Geethu, C. S. Kartha, and K. P. Vijayakumar, “Improving the performance of ITO / ZnO / P3HT : PCBM / Ag solar cells by tuning the surface roughness of sprayed ZnO”, Solar Energy, vol. 120, p65-71, (2015).
- R. A. Belisle, W. H. Nguyen, A. R. Bowring, P. Calado, X. Li, S. J. C. Irvine, M. D. McGehee, P. R. F. Barnes, and B. C. O'Regan, “Interpretation of inverted photocurrent transients in organic lead halide perovskite solar cells : proof of the field screening by mobile ions and determination of the space charge layer widths”, Energy Environmental Science, no. 1, p192-204, (2017).
-
W. Yang, T. Lin, S. Lien, and L. Wang, “Low-energy ion implantation for shallow junction crystalline silicon solar cell”, Solar Energy, vol. 130, p25-32, (2016).
[https://doi.org/10.1016/j.solener.2016.01.059]

-
I. Y. Y. Bu, and T. Hu, “The role of various carbon nanomaterials for dye-sensitized solar cells applications”, Solar Energy, vol. 130, p81-88, (2016).
[https://doi.org/10.1016/j.solener.2016.02.001]

-
M. Abutayeh, A. Alazzam, and B. El-khasawneh, “Optimizing thermal energy storage operation”, Solar Energy, vol. 120, p318-329, (2015).
[https://doi.org/10.1016/j.solener.2015.06.027]

-
J. Zhang, L. Zhao, S. Deng, W. Xu, and Y. Zhang, “A critical review of the models used to estimate solar radiation”, Renewable and Sustainable Energy Reviews, vol. 70, p314-329, (2017).
[https://doi.org/10.1016/j.rser.2016.11.124]

- J. Gorenstein, and R. A. Hakvoort, “A review of the North Seas offshore grid modeling : Current and future research”, Renewable and Sustainable Energy Reviews, vol. 60, p129-143, (2016).
-
L. Meng, E. Riva, A. Luna, T. Dragicevic, J. C. Vasquez, and J. M. Guerrero, “Micro grid supervisory controllers and energy management systems : A literature review”, Renewable and Sustainable Energy Reviews, vol. 60, p1263-1273, (2016).
[https://doi.org/10.1016/j.rser.2016.03.003]

-
D. Limon, M. Pereira, and D. Mu, “Robust economic model predictive control of a community micro-grid”, Renewable Energy, vol. 100, p3-17, (2017).
[https://doi.org/10.1016/j.renene.2016.04.086]

-
D. Palit, and K. R. Bandyopadhyay, “Rural electricity access in South Asia : Is grid extension the remedy? A critical review”, Renewable and Sustainable Energy Reviews, vol. 60, p1505-1515, (2016).
[https://doi.org/10.1016/j.rser.2016.03.034]

-
G. Shrimali, S. Srinivasan, S. Goel, and D. Nelson, “The effectiveness of federal renewable policies in India”, Renewable and Sustainable Energy Reviews, vol. 70, p538-550, (2017).
[https://doi.org/10.1016/j.rser.2016.10.075]

-
N. Iwasaka, S. Kuwashima, H. Otobe, K. Hanawa, H. Hagiwara, and R. Suzuki, “In situ measurement of incoming solar radiation by voluntary ships in the western pacific”, Journal of Oceanography, vol. 50(no. 6), p713-723, (1994).
[https://doi.org/10.1007/bf02270501]

-
M. Guadalfajara, M. A. Lozano, and L. M. Serra, “Simple calculation tool for central solar heating plants with seasonal storage”, Solar Energy, vol. 120, p72-86, (2015).
[https://doi.org/10.1016/j.solener.2015.06.011]

-
L. Menyhart, A. Anda, and Z. Nagy, “A new method for checking the leveling of pyranometers”, Solar Energy, vol. 120, p25-34, (2015).
[https://doi.org/10.1016/j.solener.2015.06.033]

-
R. H. Inman, Y. Chu, and C. F. M. Coimbra, “Cloud enhancement of global horizontal irradiance in California and Hawaii”, Solar Energy, vol. 130, p128-138, (2016).
[https://doi.org/10.1016/j.solener.2016.02.011]

-
A. Madanchi, M. Absalan, G. Lohmann, M. Anvari, and M. R. R. Tabar, “Strong short-term non-linearity of solar irradiance fluctuations”, Solar Energy, vol. 144, p1-9, (2017).
[https://doi.org/10.1016/j.solener.2017.01.008]

-
J. Tanesab, D. Parlevliet, J. Whale, T. Urmee, and T. Pryor, “The contribution of dust to performance degradation of PV modules in a temperate climate zone”, Solar Energy, vol. 120, p147-157, (2015).
[https://doi.org/10.1016/j.solener.2015.06.052]

-
M. N. I. Sarkar, and A. I. Sifat, “Global solar radiation estimation from commonly available meteorological data for Bangladesh”, Renewables: Wind, Water, and Solar a Springer Open Journal, vol. 3(no. 6), p1-14, (2016).
[https://doi.org/10.1186/s40807-016-0027-3]

-
D. Li, W. Ju, D. Lu, Y. Zhou, and H. Wang, “Impact of estimated solar radiation on gross primary productivity simulation in subtropical plantation in southeast China”, Solar Energy, vol. 120, p175-186, (2015).
[https://doi.org/10.1016/j.solener.2015.07.033]

-
J. N. Roy, “Modelling of insulation characteristics of Solar Photovoltaic ( SPV ) modules”, Solar Energy, vol. 120, p1-8, (2015).
[https://doi.org/10.1016/j.solener.2015.06.036]


