Development of ship noise analysis program based on the combination of simplified Janssen method and SEA method
Copyright ⓒ The Korean Society of Marine Engineering
This is an Open Access article distributed under the terms of the Creative Commons Attribution Non-Commercial License (http://creativecommons.org/licenses/by-nc/3.0), which permits unrestricted non-commercial use, distribution, and reproduction in any medium, provided the original work is properly cited.
Abstract
The comprehensive CAE software development company TechnoStar (hereinafter, TS) has developed the Ship Noise Analysis Program (hereinafter, SNA Program), under the instruction of Dr. H. Shuri, Professor at Tokai University, who has been leading the joint research and development with ClassNK and ten shipbuilding companies in Japan, under the scheme of “ClassNK joint R&D for the maritime industry.” The SNA program with its outstanding capabilities such as (1) easy and quick creation of analysis model, (2) closer link with acoustic data base, (3) precise simulation based on the SEA algorithm, and (4) excellent operability by means of versatile GUI, has been making a significant contribution to accomplishing the joint development of a Ship Noise Prediction System which will provide an effective and strong design tool for customers to comply with the noise level code of the International Maritime Organization (IMO).
Keywords:
Ship noise, Janssen method, SEA method, Structure-borne and air-borne noise1. Introduction
To conform to the IMO code for ship noise levels of the concerned ships, the most important functions required in a ship noise prediction system are: (1) a more precise estimation function by the best use of past available data in the early design stage, (2) an appropriate adjusting function to measure data through the rational tuning procedures in the verification stage of the ship production phase, and (3) the most effective and optimum countermeasures, if any, to maintain noise levels as required by the IMO code [4] in the final stage of ship delivery.
The SNA Program has been developed to enable the above functions to be performed easily, quickly, and precisely.
2. Computational Algorithm of Ship Noise
The computational algorithm of the SNA Program is based on the most practical method specialized for the ship noise prediction that combines the simplified Janssen method and the simplified SEA method, as proposed by Professor Shuri in the NK Joint Research [1].
In this algorithm, the following five types of the sound sources are taken into account for the prediction of cabin noise in question: structure-borne sound LpS, air-borne sound LpA, air conditioner and ventilator noise LAC, exterior fan noise LFN, and funnel exhaust noise LEX.
The resultant sound pressure level Lp in the concerned cabin is evaluated by the following logarithmic summation of the noises caused by each sound source.
| (1) |
2.1 Structure-Borne Sound
As structure-borne sound is the most significant factor for ship noise prediction, it is necessary to apply an analytical method in order to numerically evaluate the sound energy transmission mechanism considering the various complex structures (material, shape, and size) and transmission factors of the sound power incident, reflection, absorption, radiation through transmitting route from the sound sources to cabins, instead of an empirical method such as the Janssen method.
Therefore, the SEA method is selected to be applied in this study, by simplifying the sound power transmission mechanism and the analysis structure model, as practically as possible.
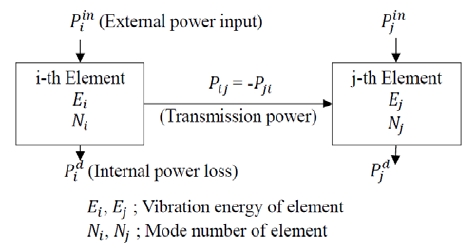
By applying the statistical averaging procedure in specifying the frequency range, the transmitted power flow between adjacent elements is shown in Figure 1 and calculated by the fundamental power balance equation as shown in Equation (2). The transmitted power Pij(=Pij) depends on the difference of vibration energy levels of elements Ei , Ej and the internal power loss in element .
| (2) |
where, ω is the center angular frequency in 1/3 or 1/1 octave band and ηi(ω) is the internal loss factor of the specific material of panel element on the frequency basis, which is experimentally verified and specified in the vibration transmission database.
The coupling loss factor ηij(ω) is calculated by the group velocity of the flexural wave on flat panel element cgi and the connected joint condition cτ as per Equation (3) and Equation (4).
| (3) |
| (4) |
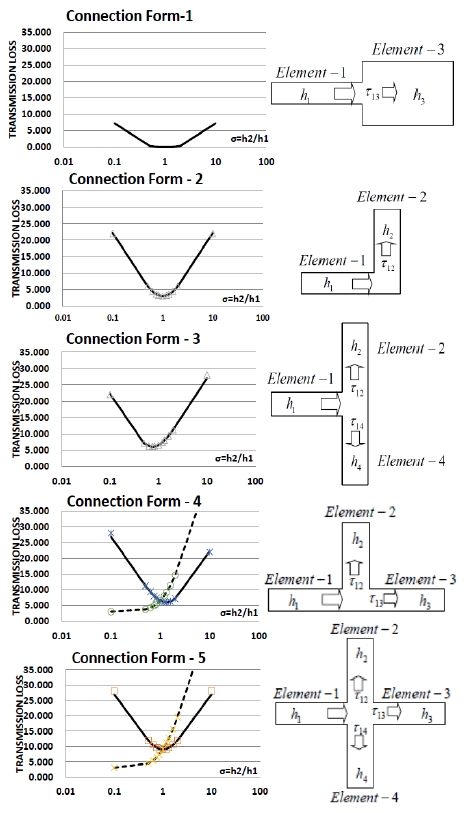
where, Lcij is the joint length between element i and j, and Si is the area of element i. In addition, τij is the vibration energy transmission efficiency at the joint which is computed by the fundamental formula of L. Cremer and M. Heckl [2] for each flat plate connection form as shown in Figure 2.
Here, the vibration energy transmission is estimated by considering only the flexural vibration mode on the flat panel element as simplified.
Furthermore, the mode number Ni existing in the range of band width Δω at the center frequency ω is given as Equation (5).
| (5) |
where, Si, Mi, and Biare the area, surface density, and bending stiffness of the flat panel element, respectively.
Moreover, the radiation loss factor , the boundary loss factor , and the damping loss factor are introduced into the power balance equation, so that the influences of power losses on sea water under the ship draft, other structures out of the analysis modeling range, and the application of special damping construction are considered.
The resultant sound power transmission is calculated by solving the simultaneous equations for all the elements in the concerned model.
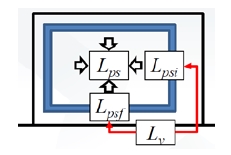
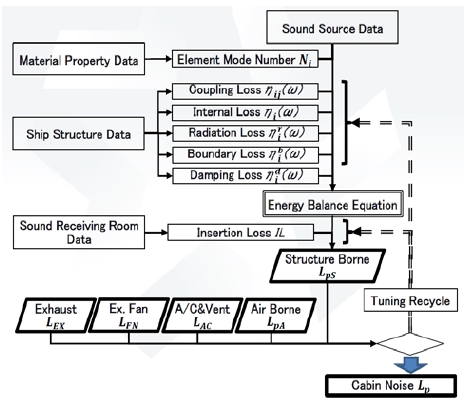
Figure 3 shows the analysis process for cabin noise due to structure-borne sound.
As we can estimate the vibration velocity level Lv on the deck structure under the concerned cabin, by the solution of the power balance equations, the cabin sound pressure level Lps is predicted as the summation of the sound pressure level Lpsf radiated by the floor vibration and sound pressure levels Lpsi radiated by the surrounding walls and ceiling as per the following Equation (6) ~ (8), taking into consideration the floor insertion loss ILnby special application such as the floating floor, the transmission loss ∆Lvwi from deck to wall, and the average acoustic radiation efficiency of members of the sound receiving room , which are experimentally verified and specified in the sound receiving room database, including the data of area of floor Sf and each walls Si and the sound absorption area of the sound receiving room AE.
| (6) |
| (7) |
| (8) |
2.2 Air-Borne Sound
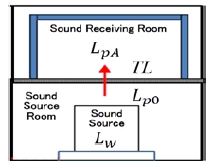
The air- borne sound level LpA in the sound receiving room is predicted by the sound pressure level Lp0 in the adjacent sound source room or by the sound power level Lw of the sound source device as shown in Figure 4 and as per Equation (9) and Equation (10). In addition, the calculation of the air- borne sound level LpA requires the data of the sound absorption area in the sound source room AS and the sound receiving room AE, the sound transmission loss TL, and the area S of the partition wall/deck plate. The verified data measured at the shop test or sea trial are specified in the database.
| (9) |
| (10) |
2.3 Air Conditioner and Ventilator Noise
As shown in Equation (11) and Equation (12), the sound pressure level LAC in the cabin is given by the measured data or predicted by the power level of sound source LACw in front of the air outlet of the air conditioner or ventilator. Here, the directivity factor Q, the distance r from the point of the sound source, the room constant of sound receiving room R, the mean sound absorption coefficient , and the total surface area S of the cabin are taken into account.
| (11) |
| (12) |
2.4 Exterior Fan Noise
As shown in Equation (13) ~ Equation (15), the sound pressure LFN in the cabin caused by the exterior fan noise is predicted by the measured sound pressure level LFNp or sound power level LFNw at a distance of 1 m from the exterior fan, and the attenuation of the distance r from the fan to the sound receiving room. In addition, the sound transmission loss TL of the walls and roof, and the directivity factor Q are taken into account. Here, the effect of sound diffraction is not considered.
| (13) |
| (14) |
| (15) |
2.5 Funnel Exhaust Noise
Similarly to the exterior fan noise, the sound pressure LEX in the cabin caused by the funnel exhaust noise is predicted by the measured sound pressure level LEXp or sound power level LEXw at a distance of 1 m apart from the funnel top, as per Equation (16) ~ Equation (18).
| (16) |
| (17) |
| (18) |
3. System Design of SNA Program
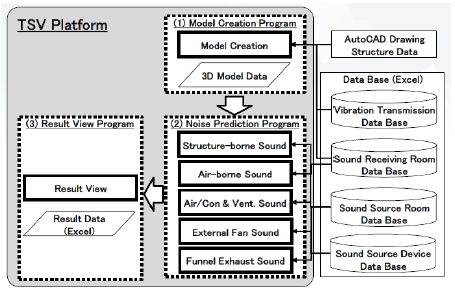
The dedicated SNA Program based on the algorithm described in the previous section is composed from three sub programs as shown in Figure 5, which are developed on the platform of TS multi-purpose CAE software “TSV-Pre” (hereinafter, TSV).
3.1 Supporting Database System
All necessary data for the model creation and noise prediction analysis are defined in the supporting database system (hereinafter, DB) as per the formulated MS Excel format as shown in Table 2, which are specified and updated on the basis of the data verified by shop tests, measurements at sea trial, and so on, by each user.
The entire DB can be automatically controlled by the DB control function in the DB system which enables the following functions:
① Selecting and importing necessary data files from the DB
② Data format conversion to TSV
③ Data check, error detection, and notification
3.2 Model Creation Program
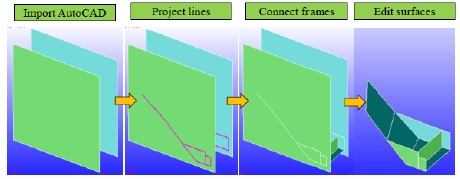
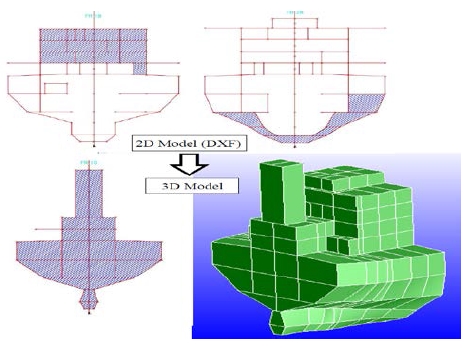
The 2D forms of the relevant frame sections of the hull structure are defined by using the point, line, and surface layer data that are extracted from AutoCAD data (dxf format) by the layer control method. Then, the 3D analytical model can be automatically created on the platform of TSV by placing the 2D forms in the order of the identified frame number and connecting the adjacent points, lines and surfaces as per the following steps as shown in Figure 6 and Figure 7.
Step-1: Import the 2D cross-sectional data from AutoCAD data and identify their frame position data.
Step-2: Project the cross-sectional lines onto the cross-section plane.
Step-3: Connect the adjacent frames’ data and create surfaces.
Step-4: Edit (cut, add or delete) surfaces, as needed.
As shown in Figure 8, the simplified model is composed from flat panels of the significant structures for energy transmission elements, such as shell, deck, and wall, excluding stiffeners.
The effectiveness and accuracy of the prediction using these simplified models has been validated by comparison of the measured results in actual ships and the predicted results.
Thus, it is confirmed that the easy and quick creation of analysis models has a significant impact on saving the time and effort required for ship noise analysis thereby providing a high potential tool for the optimum design of ship noise control.
3.3 Noise Prediction Program
Here, the simplified SEA method is applied, where only the sound energy transmission due to the flexural vibration modes of an element is taken into account.
The effects caused by the simplified analysis can be adjusted by introducing a tuning process for the loss factors such as the internal loss factor ηi and the coupling loss factor ηi as shown in Figure 9. The effectiveness of this procedure has been experimentally validated [3].
Moreover, the operation of the noise prediction is easily executed by one-push, using the simplified model and the formulated DB system, according to the following six functional steps by the work bench as shown in Figure 10.
① Create model function (Model read on to TSV)
② Modify model function (Model merge, add parts, and delete)
③ Set property function (Read DB, and define calculation condition, material and thickness, damping material, pillar, draft, tank and boundary condition)
④ Set source function (Define sound source of Structure-borne, Air-borne, AC &Vent, Ex. Fan and Exhaust sound)
⑤ Run solver (Perform analysis as per the program flow shown in Figure 9, by 1/1 or 1/3 Octave band basis, and recalculate due to the modification of the model and DB for tuning operation.
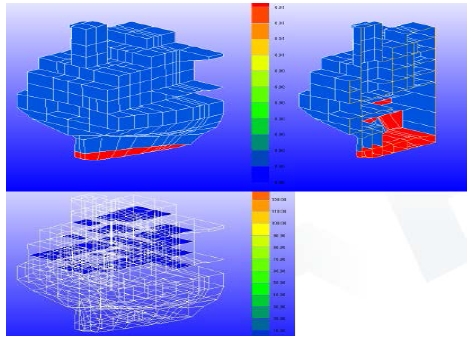
⑥ Show result function (Display of analysis results for confirmation, by overall value, octave band curve, and contour figure (vibration velocity/acceleration/energy, sound pressure, element thickness, mode number, and loss factors)
3.4 Result View Program
To verify the analysis results in comparison with the measured data, the following two functional steps are performed after step ⑥ in the previous subsection.
⑦ Plot function (Output of calculation result for verification study by plotting the response of elements, frequency and cabin on the basis of frequency or element)
⑧ Tuning function (MS Excel file output of factors for tuning)
The cycle of steps from ⑧ back to ⑤is repeated for the tuning operation as shown in Figure 9, which is the most important and invaluable function for practical ship noise control procedures with reference to the measured data.
4. Conclusion
The SNA Program was developed in accordance with the computational algorithm based on the combination of the simplified Janssen method and simplified SEA method under the instruction of Professor H.Shuri.
This program has outstanding capabilities in ship noise prediction: easy and quick model creation, close link to the formulated DB, precise simulation of the phenomenon of vibration transmission, and excellent operability.
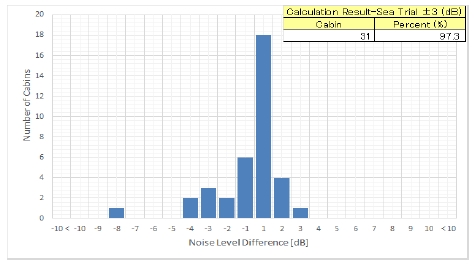
The analysis accuracy for noise prediction must depend heavily on the accuracy of the sound energy loss factors, and it has been confirmed that this method can provide the correct prediction by using the verified factors as shown in Figure 11.
Meanwhile, the tuning function of this program is invaluable to define the most suitable factors to adjust to the verified value, and will be expanded to the automatic optimum tuning by using sensitivity analysis and the curve fit method.
Acknowledgments
The SNA Program was developed under the instruction of Professor H.Shuri leading the Joint Research & development with ClassNK and 10 Shipbuilding Companies in Japan.
This paper is extended and updated from the short version that appeared in the Proceedings of the International symposium on Marine Engineering and Technology (ISMT 2016), held at Korea Maritime and Ocean University, Busan, Korea on November 3-4, 2016.
References
- H. Shuri, “Development of noise prediction program for acoustic ship designs”, ClassNK Technical Bulletin, 31, p1-22, (2013).
- L. Cremer, and M. Heckl, “Structure Borne Sound”, Springer Verlag Berlin, (1973).
- H. Shuri, “Ship noise prediction program based on vibration and acoustic data base”, Annual Spring Meeting of The Japan Society of Naval Architects and Ocean Engineers (JASNAOE), May 26-27, (2016), (in Japanese).
- IMO/MSC 91/22/Add.1 Annex 1, Resolution MSC.337(91).


