Changes in work accuracy in a noisy environment : A case of work accuracy in the marine engine room environment
Copyright ⓒ The Korean Society of Marine Engineering
This is an Open Access article distributed under the terms of the Creative Commons Attribution Non-Commercial License (http://creativecommons.org/licenses/by-nc/3.0), which permits unrestricted non-commercial use, distribution, and reproduction in any medium, provided the original work is properly cited.
Abstract
It is a requirement that the noise level in the engine rooms of modern ships meet the International Maritime Organization (IMO) noise level code criteria. This standard comes as it had been revealed that, in noisy environments, ship engineers are uncomfortable and lack concentration, and as a result might experience a reduction in work accuracy. In a noisy environment, it has been found that engineers not only feel fatigued but also work with less precision. These facts have been empirically demonstrated.
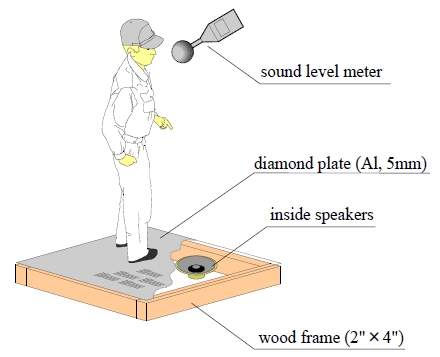
In the laboratory, a noisy environment was reconstructed by playing the machine operating sound, recorded in a ship engine room, and laying down metal floor plates similar to those found in a ship engine room. Speakers were installed under the metal floor plates, and the recorded machine operating sounds were played back from the speakers during the experiments. In the experiments, the participants were asked to perform work tasks in the noisy environment. The participants’ biological responses were measured during the experiment. The output from speakers during the experiment was measured by a precision sound level meter at a height corresponding to the ear level of the participant.
In this study, we measured biological responses, such as heartbeat and brain waves (alpha band wave, beta band wave, etc.), as an evaluation index. From the biological responses, we estimated the participants’ mental workload in the noisy environment.
Keywords:
Noisy environment, Mental work load, Work fatigue1. Introduction
The amendment to SOLAS II-1/3-12 [1] to include noise protection for the operation of machinery in engine rooms was adopted in 2012. When noise levels are >85 dB in the working space of a vessel, workers should wear hearing protection. There are many sources of sound in an engine room. The presence of machines that run continuously or intermittently result in sound levels that vary depending on the on/off status of machinery.
Walker et al. [2] previously carried out a study on noise exposure. Their experimental results suggest that exposure to noise, in particular to low-frequency noise, negatively impacts heart rate. There are many sources of noise in the ship engine room.
Knowledge of the effect of noise on mental work demand may lead to further modification of IMO’s guidelines regarding noise in work environments, which could then lead to optimal noise levels for workers. Also, worker will able to change their work plan in noisy environment due to knowledge of work accuracy. . This may allow work accuracy to be maintained in the noisy engine room. In addition, preventing the decrease in work accuracy associated with a noisy environment may result in safer running of the machine, a necessary condition for a safe voyage.
In this study, participants solve a task on a personal computer (PC) display in a noisy environment. During these experiments, the biological responses of the participant are measured. Then, we analyze the measured data quantitatively to understand the effect of noise.
2. Materials and Method
This study is involving the human participants. We have approval of this study regard by Graduate School of Maritime Sciences in Kobe University. The laboratory floor is laid out with aluminum metal floor plates to imitate an engine room floor, and speakers are installed underneath the aluminum metal plate in order to recreate the engine room sounds.
The true noise sounds, recorded from a diesel generator in a ship’s engine room, are played while the participant solves a task on a PC. The participant stands on the metal plate for the duration of the experiment. The sound pressure level is measured using a precision sound level meter (Rion Inc., Japan) placed at the height of the participant’s head. The sound volume is adjusted to 85 dB by an amplifier.
2.1 Experimental apparatus
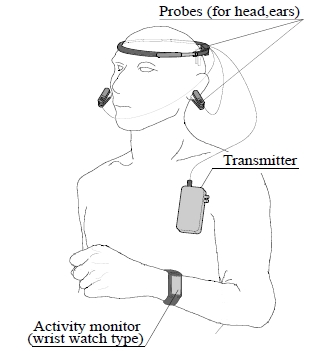
During the experiment, the participant wears a portable EEG sensor and wristband-type activity monitor. Compared with a chest band, the wristband heart rate sensor is more comfortable and less cumbersome for the participant. The wrist monitor is connected to the PC, and the recorded and the heartbeat data become conveniently available for analysis. The study population consisted mainly of university students who use wristband-type activity monitors in their daily lives. Therefore, the experiment provides authentic data.
2.2 sensors
The heart rate (HR) is represented by heartbeats per minute in this report. HR is measured with a wristband activity monitor (A360, Polar Electro Inc.,Japan) in this experiment. The HR sensor is installed on the activity monitor. On the monitor display, the estimated HR value is displayed every one seconds. The wristband monitor saves the HR data to its internal memory during activity.
A portable electroencephalogram (sampling frequency: 126 Hz, Digital Medic, Inc., Muse Brain system) is used to measure the participant's brain waves in this experiment. This model measures brain waves by placing an electrode on the back of the head and on both earlobes. The detected signal is sent to the receiver by radio wave.
By analyzing the frequency of the received signal, the alpha wave band (8-13 Hz), beta wave band (20-25 Hz) and theta wave band (4-7 Hz) intensities are obtained.
2.3 n-back task experiment
The participant performs the n-back task [3] on the PC display. The n-back task is a continuous short-term memory task. The participant judges the order of appearance of a alphabet every 2.5 second. The task difficulty is changed by the number of variations in the appearance, which requires the participant to remember the exact order.
2.4 NASA- task load index
NASA-task load index (NASA-TLX) [4] is one of the methods for the estimation of task load for comparison with a work situation load. Originally, the NASA-TLX was developed to understand the mental stress of aircraft pilots to allow for optimal design of airplane cockpits.
The answer sheet consists of six evaluation components and pairwise comparison questions. The evaluation components are as follows:
- Mental Demand - Physical Demand
- Temporal Demand - Performance
- Effort - Frustration
2.5 Mahalanobis generalized distance
Mahalanobis generalized distance (MD) [5][6] is calculated using the biological reaction data from the participant.
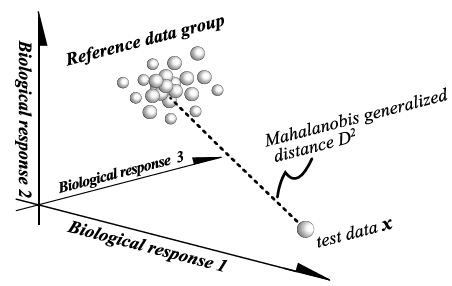
The biological reaction data are used as test data in the formula. MD is depicted as the similarity between the reference data group and test data. Figure 3 shows the arrangement of spatial distance in the MD method.
MD uses multiple evaluation items and calculates the spatial distance between the study data group and the test data. In this study, heartbeats per minute and the brain wave signals are used as evaluation indices. Equation (1) shows the calculation of the MD.
The MD and probability density are used to determine data normality.
| (1) |
3. Result and discussion
3.1 Heart rate and brain signals
The Eight 4th year university students participated in the study. Four of the eight students will go on to work as marine engineers after graduation. All declared their physical condition to be fine before experiment.
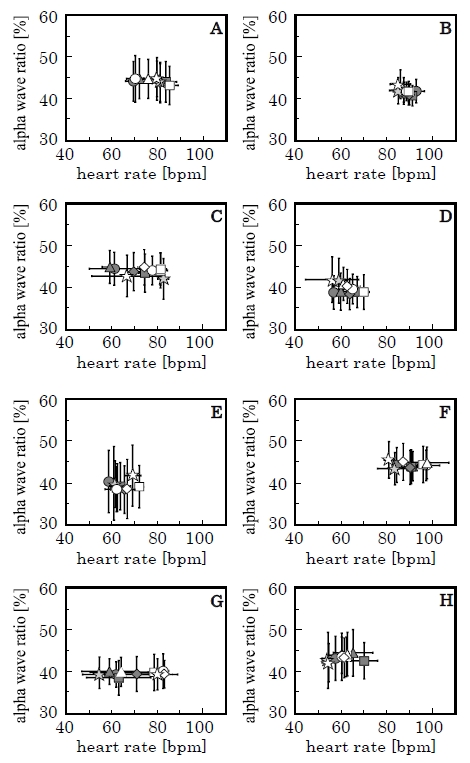
Figure 4 shows the students’ heart rate and alpha wave ratio as a biological response in the experiment. Each symbol depicts an average value; the error bars depict standard deviation. The symbols differ by levels of the n-back experiment. The circle denotes 0-back, the triangle denotes 1-back, the square denotes 2-back, and the diamond denotes 3-back for difficulty level. The star symbol denotes the average data during the rest condition between experiments. The hatched symbols depict the data measured in the noisy environment. These data were measured during each situation at 75-second intervals. Heart rate data are shown as estimated average beats per minute (bpm) in the experiment.
The brain wave bands were calculated using fast Fourier Transform analysis. Each brain wave band signal density was summed, and the band ratio calculated by dividing percentage by total density. Typical student responses were observed in this experiment. Some of students are seems clearly affected by noisy environment. However, some student seems not affected its.
In student B’s results, changes in response were affected by task difficulty. His heart rate gradually increased from his normal resting heart rate (star figure). Also, his HR variance and alpha wave ratio were very small. Similar changes were found in students C, F, and H.
The tendency for an increase in the heart rate is a characteristic response of people who are concentrating and working hard. Student D’s data illustrate the difference between the rest situation and the task situation in the alpha wave ratio. In general, a decrease in the alpha wave ratio is representative of nervousness. At the same time, other band ratios may increase (e.g. the beta wave ratio increases when people feel nervous).
In these figures, students B, D, F, and H show a similar tendency in change in heart rate. Their average heart rate increased during the task situation. It is evident that heart rate was affected by physical activity. However, physical exertion was not taken into consideration in this experiment because the students sat on chairs throughout the entire experiment.
However, it is well known that heart rate changes when we feel a fearful or nervous. Eventually, when the difficult problem is solved, our heart rate will become constant, but will remain slightly elevated.
At the beginning of the experiment we measured the biological response in a normal situation for each student. The experiments were then done under noisy conditions in the same laboratory. It is possible that the students felt nervous prior to the experiments.
3.2 Statistical testing of data
The measured data were analyzed using 2-tailed t-tests. Table 1 shows the results of the t-tests. The value in the upper half of the cell is the t-value, and the value of lower half of the cell is the pvalue. The asterisk (*) denotes that the p-value is less than 0.05, which shows a significant difference between the normal situation and the noisy situation in students’ biological responses.
In Table 1, most of the significant findings were for heart rate. Some p-values for alpha wave ratios showed a significant difference between the two situations. Therefore, we decided that both heart rate and alpha wave ratio were used as evaluation item of Mahalanobis generalized distance (MD) calculation.
3.3 NASA-TLX
Table 2 shows the NASA-TLX scores comparing the two different situations. In the noisy environment, students may feel additional stress. Therefore, we considered the difference in the NASA-TLX score between the situations to indicate the added stress of the noisy environment.
The scores that increased in the noisy environment are shaded in Table 2. Student B did not complete the NASA-TLX questionnaire. Student A's 3-back could not be calculated due to technical issues.
3.4 Mahalanobis generalized distance
Mahalanobis generalized distance (MD) and probability density may account for the similarity in between student's resting condition and other condition which changed task difficulty or environment. In this analysis, HR and alpha wave ratio were used as evaluation elements.
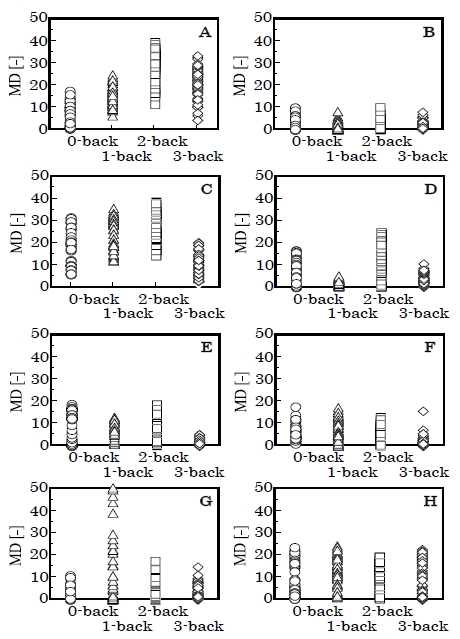
Figure 5 shows the calculation result of MD, comparing the resting condition and the task situation in a non-noisy situation. The plots are separated by task levels.
The MD changes of student A, seemed to increase from 0-back to 2-back. Students C and G, showed the same tendency. Most students’ MD decreased in the 3-back result. This finding indicates that the students’ condition was similar to their rest situation. Student B's MD value was lower than the other students for almost every task level. This result suggests that his heart rate and alpha wave ratio may not affected by task difficulty.
Following the experiment, student A provided an explanation regarding the difficulty of the n-back task in an interview.
Student A found the 2-back task to be the most difficult task in the experiment. He stated that he gave up on solving the problem in the 3-back task. He reported feeling bored in the 0-back task, which can be very easy for students.
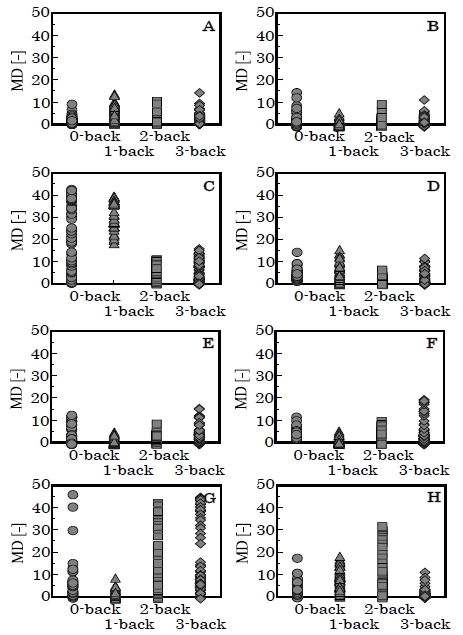
The data similarity between the noisy situation and the normal situation is shown in Figure 6. During each task situation, the MDs were calculated using heart rate and alpha wave ratio. Student A’s noisy condition data are similar with his normal condition data. The average MD are: minimum 1.49 (at 0-back) to maximum 4.53 (at 1-back). This result shows that student A is not easily affected by noisy situations. Student B also seemed unaffected by noisy situations. On the other hand, in the cases of students C and G, it seems that they are affected by noisy environments. For student C, the maximum average was 31.69 in the 1-back. However, the MD of the 2-back and 3-back situations are small. If she gave up on these tasks when she experienced difficulty during the 2-back or 3-back tasks, her condition may not differ between noisy and quiet environments.
The result of the 1-back situation for students E and G showed small MD values. However, their MD calculated using normal situation data (Figure 5) are different from the other students’ data. We assume that both students were not affected by noisy environments in the 1-back task, but student G's result seems clearly affected by the noisy environment in the 2-back and 3-back tests (Figure 6).
3.5 Work accuracy
In n-back task, students used their judgment to provide the result. The tasks consist of combining target letters and non-target letters. During the experiment, the student should answer "yes" for the ten targets, and "no" for the twenty non-targets.
Table 3 shows the scores for all students in the n-back task experiment. The misjudged scores, unequal to 10 or 20, are shaded in the table. The shaded scores mostly appear in the noisy situation, with the exception of during highly difficult tasks. After the experiment, student A told the experimenter that it is difficult to concentrate under noisy environment. Student A’s score decreased during noisy situations.
4. Conclusion
The engine department staff are exposed to operational sounds in ships’ engine rooms. Very long exposure to high noise levels can cause the staff to develop deafness. As well, the mental demand increases in a noisy work environment.
Several experimental results indicate the effects of noise. However, not all of the student responses were similar. Some of the students showed typical responses for noisy environments. For these students, some habits seem to explain the results of the experimental data.
In this study, we tried to evaluate the workers’ mental workload quantitatively by performing experiments using university students. These experiments are a basic way to evaluate the workers’ stress. For higher accuracy, more study is required that includes a wider variety of data, such as an age, gender, work experience, rank of officer and ship type. These trials will be continued.
Further, the noise characteristics are different for different machinery. In the engine room environment, there are various noise situations. For example, slow speed diesel engines are used as main engines, while the ones with medium speed are employed as generator engines. The noise frequency changes with machinery speed.
We must bring into legislation not only to codes for noise levels, but also rules to reduce them effectively to suit the health requirements of personnel working in these environments.
Acknowledgments
These experiments were cooperated with university student of marine engineering course who become marine engineers next year. We would like to thank these future engineers.
This paper is extended and updated from the short version that appeared in the Proceedings of the International symposium on Marine Engineering and Technology (ISMT 2016), held at Korea Maritime and Ocean University, Busan, Korea on November 3-4, 2016.
References
- Class NK Technical Information, No. TEC-0947, https://www.classnk.or.jp/hp/pdf/tech_info/tech_img/T947e_for_attachment.pdf Accessed December 12, 2016.
- E. D. Walker, A. Brammer, M. G. Cherniack, F. Laden, and J. M. Cavallari, “Cardiovascular and stress responses to shortterm noise exposures - A panel study in healthy males”, Environmental Research, 150, p391-397, (2016).
-
T. S. Braver, J. D. Cohen, L. E. Nystrom, J. Jonides, E. E. Smith, and D. C. Noll, “A parametric study of prefrontal cortex involvement in human working memory”, NeuroImage, 5(1), p49-62, (1997).
[https://doi.org/10.1006/nimg.1996.0247]

- S. G. Hart, "Development of NASA-TLX (Task load index): Results of empirical and theoretical research", Advances in Psychology, 52, p139-183, (1988).
- H. Yanai, Hand Book of Multivariate Analysis, Gendai-Sugakusya, p272, (1986), (in Japanese).
- A. P. Dempster, Element of Continuous Multivariate Analysis, Addison-Wesley Publishing Company, p203-209, (1969).

