Energy consumption reduction by battery-connected power management systems of ships under various operating modes
Copyright ⓒ The Korean Society of Marine Engineering
This is an Open Access article distributed under the terms of the Creative Commons Attribution Non-Commercial License (http://creativecommons.org/licenses/by-nc/3.0), which permits unrestricted non-commercial use, distribution, and reproduction in any medium, provided the original work is properly cited.
Abstract
In recent times, there have been a number of studies on reduction in energy consumption in ships. As part of those studies, research to reduce the energy usage of generators and the batteries are underway. In this study, an energy saving method is suggested by comparing a battery-powered ship with an existing ship. For this, we categorized the ship 's operations into different modes and calculated the ratio of the ship's energy consumption for different operation modes for one year. In addition, the average and maximum values of power consumption in each operation mode were obtained and modified to fit the implemented simulator. The experiment was carried out according to the operation mode through the simulator. We calculated the fuel consumption according to the operating mode using the specific fuel consumption (SFC) curve and the engine load obtained from the experiment. The energy saved is calculated by multiplying fuel consumption and operating rate.
Keywords:
Battery connected power management system, Energy saving, operating mode1. Introduction
In recent times, there have been many studies on the reduction of energy consumption in ships. In particular, the international maritime organization (IMO) mandated the ship energy efficiency management plan (SEEMP) in 2013. As part of those studies, research to reduce energy consumption when powered using the generator and battery are underway [1]. If the ship uses a hybrid system including batteries, energy consumption and CO2 emission can be reduced in various ways. Because the generator operates at a high load owing to the battery, a hybrid system can reduce specific fuel consumption and incomplete combustion. In addition, this system can be used to reduce the capacity and number of generators. This study calculates the energy savings by comparing an existing ship and battery-powered ship.
2. Ship operation and power status
A ship has several operating modes, such as voyage, arrival, departure, port, unloading, drifting, and anchoring. The operating modes differ depending on the type of the ship. In this paper, we analyze select vessel operating modes (voyage, maneuvering, and port) to propose generally applicable power systems.
The load usage is different depending on the mode of operation of the ship as shown in Table 1.
There are many loads while the ship is under the modes of maneuvering, voyage, and port. Table 2 shows the operating mode rate and power load of the container vessel. The rate of the operating mode was calculated for one year.
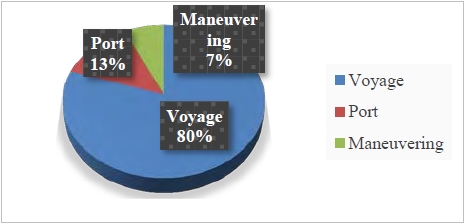
Other modes can be broadly placed under the abovementioned three modes. Based on Table 2, the operating mode rate of general container ships is shown Figure 1.
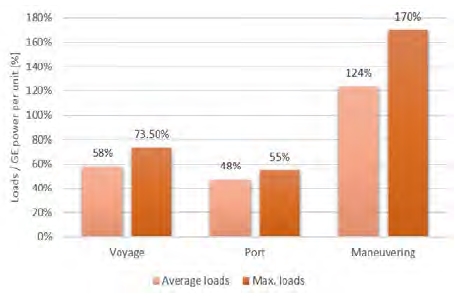
The capacity of one generator is assumed to be 1700 kW at 4600 TEU and 3000 kW at 8600 TEU. Based on the power usage obtained in Table 2, the rate of electric loads and the rated power for one generator for the operating modes was calculated, shown in Figure 2.
Four generators are installed in all the surveyed ships. Up to three generators operate in the ship, except for spare generators, for which generally one or two units are operated. In the case of a maximum load at the maneuvering mode, it is set slightly lower considering the number of generators in the simulator below. Using Figure 1 and Figure 2, the electric power use status of a typical container ship can be assumed.
3. Battery-connected power management system
Power management system (PMS) on a ship is a system that manages generators and loads for a stable power supply of the ship. This system has functions such as the management of generator operation, load control between generators, synchronization control, non-critical load cut-off, and heavy load control. The battery connection power management system includes the above functions and adds an algorithm for battery management and energy efficiency through charging and discharging. The capacity of the generator in the vessel must be capable of supplying electric power in a stable manner [2]. When choosing a generator, the maximum load is taken into consideration, but a low load is used during the voyage, which takes up most of the operation of the ship. In addition, such low-load operation can degrade power generation efficiency and adversely affect generator life because of low temperature corrosion [3].
To know the power generation efficiency of the generator, specific fuel consumption (SFC) is used. SFC is defined as follows.
| (1) |
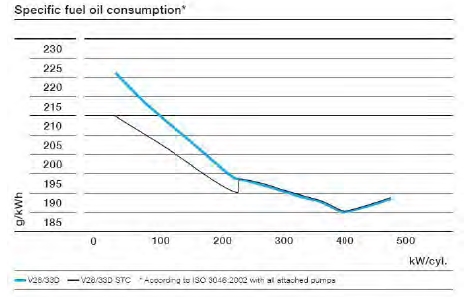
Here, m [kg/h] is the fuel consumption and Pb [kW] is the brake power of the engine. SFC [kg/kWh] is fuel consumption per 1 kWh. If the SFC is high, when it produces the same power, the fuel consumption too is high. Figure 3 shows the SFC curve of the MAN V28 / 33D diesel.
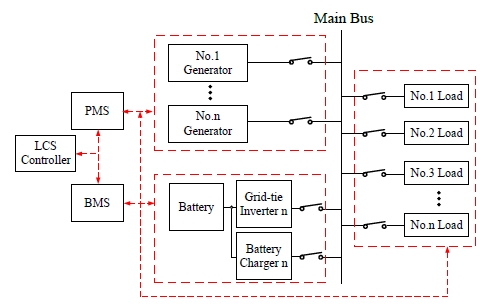
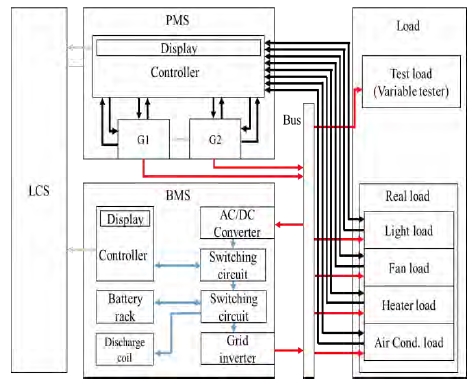
According to Figure 3, the overall SFC decreases with an increase in the generator output, and shows a minimum SFC in the load of approximately 85%. In other words, as the load increases to about 85%, the fuel efficiency increases [4]. Battery-connected power management systems utilize the battery and increase the power efficiency by operating at a higher average load [5]. In this paper, the integrated controller of the battery-connected power management system is referred to as the load control system (LCS) controller. The LCS controller monitors and controls the status of the generator and the battery via the PMS and the battery management system (BMS). Such a system is referred to as LCS. The LCS configuration diagram is shown in Figure 4.
In order to increase the total power generation efficiency using the LCS, the generator charges the battery to enable operation at 85%. This ensures that generators are not over-driving and have a high efficiency when in a low-load state. When a high load of the generator requires parallel operation, the battery discharges and supplies the power to the bus line, minimizing the low-load running time in an initial parallel operation.
When the battery is mounted on a ship, the battery should meet the IEC 62133 standard [6]. In addition, large capacity batteries can cause harmful or explosive gases. Therefore, the places where large capacity batteries are installed in ships should be isolated to explosion-proof areas to prevent explosion [7]. Location selection should be discussed in the case of future ship applications because there is a great difference depending on the type of ship, battery type, and installation capacity. Because of these problems, this system is difficult to apply to vessels in operation and should be considered during the designing of the vessel.
4. LCS simulator
We developed a simulator similar to the on-board power environment to test the battery-connected power management system. The LCS simulator tests the operation of the LCS by generating an output power of 220 V / 60 Hz / 2 P using two generator units and applying a constructed on-board load. The wiring diagram of the LCS simulator is shown in Figure 5.
The generator supplies power to a load via a magnetic contactor of the front of each load. The generator is configured to enable the phase-lock between different generators for parallel operation. The parallel operation and battery discharge are controlled by the LCS. Load power switches are controlled by PMS. Specifications of the simulator are shown in Table 3.
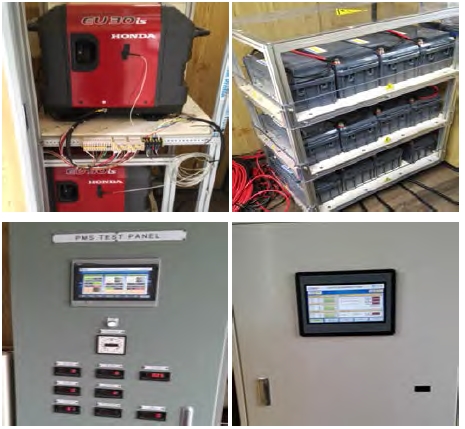
The generator used is the EU30 model manufactured by Honda and the batteries are lead acid batteries. LCS is developed as LabVEIW based on laptop, PMS is developed as PLC of LS Industrial, and BMS is developed as its own board. The photograph of generation parts and panels is shown in Figure 6.
The electric loads consist of the real load and test load; real load is the equipment to reflect the characteristics of each device. Table 4 shows the constructed electric loads in the LCS simulator.
The test load is divided programmatically using the AC load test. The real loads are composed of electric lamp, electric fan, heater, and air conditioner. Real load pictures are shown in Figure 7.
Electric loads are virtually divided into typical loads and heavy loads. Heavy load operations are used by a heavy load control algorithm. Real load No. 3 and 4 and test load No. 1 and 5 can take up high loads above 700 W. Test load No. 1 and 5 are set to typical loads for the test, while real loads No. 3 and 4 are set to heavy load.
5. Experiment
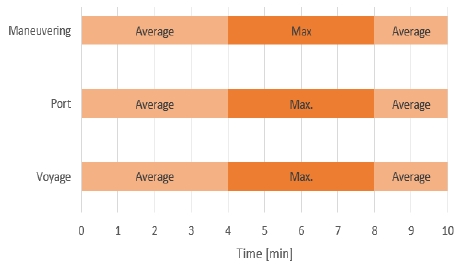
Experiments applying the LCS were conducted to evaluate the energy savings. The performance of the ship load was divided by the average load and max load as shown in Figure 2. The generator has a capacity of 3 kVA in the LCS simulator. The electric load analysis is shown Table 5.
The experiments were performed for 10 minutes for each mode as shown in Figure 8.
Based on this, the performance of the LCS vessel and the ordinary vessel are analyzed. All batteries are fully charged and are used as needed by the LCS.
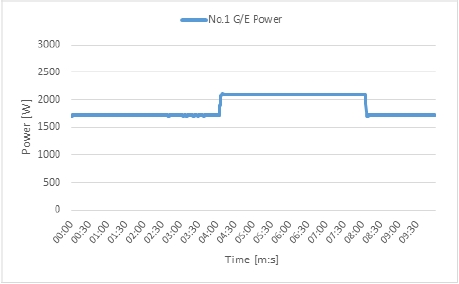
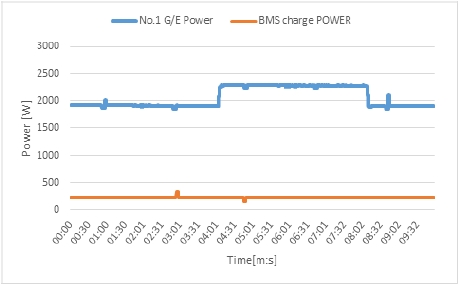
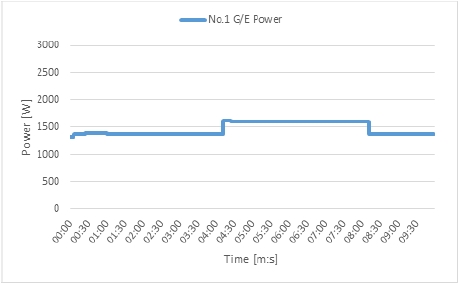
In the ordinary ship voyage mode, only one generator is used. In the LCS vessel, one generator is operated with low load, such that the remaining power is charged to the battery. Figure 9 and Figure 10 show power usage in the ordinary ship and LCS ship during the voyage mode.
The power usage in the port mode appears to be similar to that in the voyage mode. Figure 11 and Figure 12 show power usage in an ordinary ship and LCS ship during the port mode.
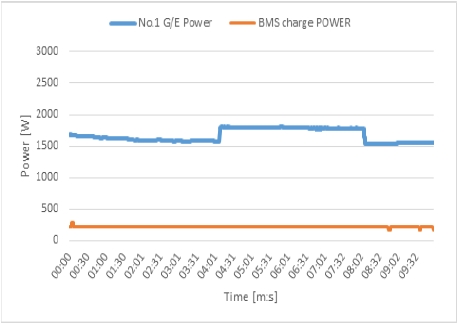
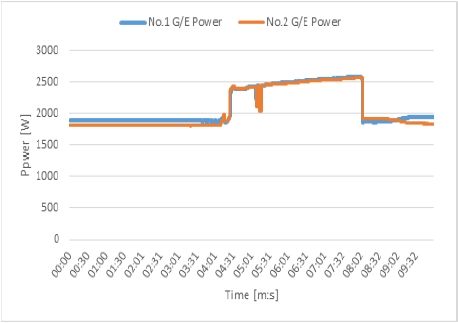
Even if the battery is charged under the maximum load condition of the voyage and port modes, the generator is not charged to 85% (2550 W) load, it is continuously charged. Therefore, the power consumption of the LCS vessel is higher than the ordinary vessel. Figure 13 shows the power graph of the ordinary ship maneuvering mode.
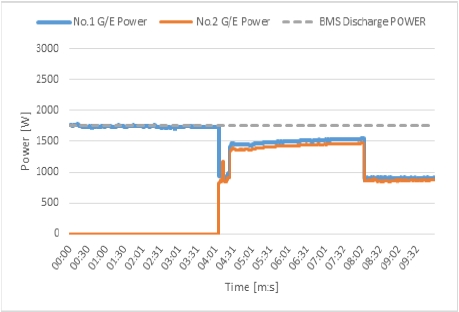
Bow Thruster (B / T) is a device that consumes the most power of the vessels by a single appliance. In this paper, it is assumed that heavy loads like the B / T are also used in both average load and max load of the maneuvering mode. Because the load is high, two generators operate. In the actual ship, three generators work frequently, but the simulator has only two generators, and therefore, only two generators operate. If three generators are driven, the generators will have a number of disadvantages of low loads. Figure 14 shows the power graph of the LCS maneuvering mode.
Rapid power consumption of the B / T maneuvering is covered by the battery. The battery is discharged, depending on when the heavy load (B / T) is used. As the load increases, the generator runs in parallel. However, when the load decreases, because the heavy loads are still on, even if the load is reduced and reaches the release point, the parallel operation will not be stopped. When heavy loads are operating on the ship, the parallel operation of the generator is not cancelled considering the amount of change of the power. In the simulator, low-load operation is more common in the vessel with LCS than in an existing vessel. However, when applied to maritime, the vessel with LCS can operate at high loads depending on load usage when maneuvering.
The fuel consumption of the ship can be obtained from the following equation.
| (2) |
Considering the operating mode, we can obtain an average fuel consumption of an ordinary ship using the following Equation.
| (3) |
MV is voyage mode rate, n is the number of generators, tVn is generator running time for voyage, PGn is Generator output, SFC is fuel consumption per 1 kWh, MP is the port mode rate, and MM is the maneuvering rate. SFC was determined using a similar expression in Figure 3. The average fuel consumption of the ship in which LCS is applied can be determined using the following equation.
| (4) |
MV(CH) is the voyage mode rate when the battery is charging and MP(CH) is the port mode rate when the battery is charging. During the rest of the periods, the battery does not charge, and the fuel consumption of the ordinary vessel is used. Assuming that the discharge continues for the duration of the maneuvering, the charging period is calculated.
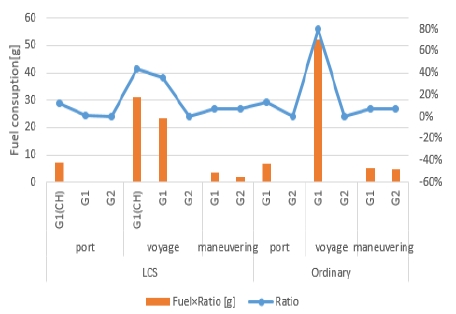
The calculation results after charging up to 56%, which is a combination of the charging from the voyage and port operating modes, is equal to the discharge amount of the battery. It can be presumed that 12% of the 13% charge occurs while at the port, while 44% of the 80% charge occurs at the voyage mode. The fuel consumption when estimated using the proposed formula is shown in Figure 15. The power consumption shown in Figures 9 to 14 is converted to fuel consumption according to the SFC curve.
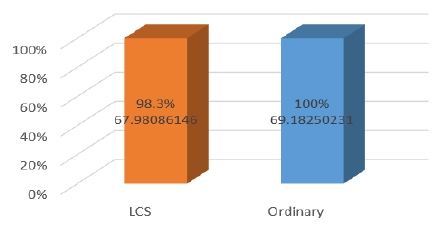
Figure 15 shows the ship's operating ratio according to the mode in Figure 1 as a blue line. The orange bar graph represents the product of the fuel consumption and the operating ratio according to equations 3 and 4. G1 (CH) represents a period for charging using Generator 1. Fuel consumption at the operating mode can be found by adding fuel consumption of G1 (CH), G1, and G2. In the LCS-applied vessel, the graph shows that fuel consumption during the voyage and port mode is high because of the battery charge, but fuel consumption during maneuvering is low. Based on the fuel consumption from Figure 15, the total fuel consumption and the energy consumption rate are shown in Figure 16.
The total fuel consumption of the LCS applied vessel is approximately 67.98 g according to the operating ratio, and the total fuel consumption of the ordinary vessel is approximately 69.18 g by the experiment. As a result, it was confirmed that 1.7% of the energy is saved.
6. Conclusions
In this paper, we classified the operations of the ship into different modes and analyzed the load according to each operation mode. Based on the analyzed load, experiments on ordinary ships and battery-applied ships were conducted. As a result, it was confirmed that the battery-applied ships saved 1.7% of the energy. However, a further reduction in energy consumption can be achieved if we improve the point that the load is low when the battery is discharged during the maneuvering mode because the number of points where three generators run is changed to two due to the limitations of the simulator. This paper can be used as a reference for studies on the reduction of energy consumption of a ship and be helpful for the development of a green ship.
Acknowledgments
This work was supported by ‘Development of EMS for Green-ship’ program funded by the Korea Institute of Marine Science.
This paper is extended and updated from the short version that appeared in the Proceedings of the International symposium on Marine Engineering and Technology (ISMT 2016), held at Korea Maritime and Ocean University, Busan, Korea on November 3-4, 2016.
References
-
H. S. Lee, and J. S. Oh, “A study on appropriate ship power system for pulse load combine with secondary battery”, Journal of the Korean Society of Marine Engineering, 37(8), p962-968, (2013), (in Korean).
[https://doi.org/10.5916/jkosme.2013.37.8.962]

- DEIF, Designers Reference Handbook - Protection and Power Management, PPM-3, Denmark, Document no.: 4189340558C.
- O. L. Klaus, L. Villetti, J. A. Siqueira, S. N. Souza, R. F. Santos, C. E. Nogueira, and C. Rosseto, “Efficiency and fuel specific consumption of an engine running on fish biodiesel”, academicJournals, 8(42), p2120-2122, (2013).
- J. D. Kim, G. S. Jung, J. E. Lee, Y. H. Song, C. H. Jung, and J. S. Choi, “Low load operation of marine auxiliary diesel engines”, Proceeding of the Korean Society of Marine Engineering 2010 conference, Mokpo, p189-190, (2010), (in Korean).
-
J. H. Jang, and J. S. Oh, “The study on a ship energy management system applied rechargeable battery”, Journal of the Korean Society of Marine Engineering, 38(2), p202-207, (2014).
[https://doi.org/10.5916/jkosme.2014.38.2.202]

- Secondary Cells and Batteries Containing Alkaline or Other Non-acid Electrolytes - Safety Requirements for Portable Sealed Secondary Cells, and for Batteries Made from Them, for Use in Portable Applications, IEC 62133 2nd Edition, (2012).
- H. S. Byeong, Ship and offshore design theory 1, SSOV publisher, (2015).
-
S. Y. Kim, B. G. Cho, and S. K. Sul, “Feasibility study of intergrated power system with battery energy storage system for naval ship”, Proceeding of IEEE Vehicle Power and Propulsion Conference, Seoul, p532-537, (2012).
[https://doi.org/10.1109/vppc.2012.6422724]

- D. Mahoney, D. Longo, Heinzel, and McGlothin, “Advanced Shipboard Energy Storage System”, ASNE EMTS Symposium, p23-24, (2012).


