A numerical study on sloshing impact loads in prismatic tanks under forced horizontal motion
Copyright © The Korean Society of Marine Engineering
This is an Open Access article distributed under the terms of the Creative Commons Attribution Non-Commercial License (http://creativecommons.org/licenses/by-nc/3.0), which permits unrestricted non-commercial use, distribution, and reproduction in any medium, provided the original work is properly cited.
Abstract
Many engineering issues are caused because of sloshing phenomena. Numerical solution methods including the computational fluid dynamics (CFD) technique, are used to analyze these sloshing problems. In this study, a numerical technique was used to analyze sloshing impact loads in a prismatic tank under forced horizontal motion. The volume-of-fraction (VOF) method was adopted to model the sloshing flow. Six cases were used to compare the effects of the natural frequencies of a simple rectangular and prismatic tank, with impact pressure on the prismatic tank wall. This study also investigated the variable pressure loads and sloshing phenomena in prismatic tanks when the frequencies were changed. The results showed that the average of the peak pressure value for ω′1 = 4.24= 4.24 was 22% higher than that of ω1= 4.6.
Keywords:
Sloshing, Impact loads, Prismatic tank1. Introduction
There are two types of containers, namely, the membrane type (prismatic) and the moss type (spherical). The membrane container is widely used in the liquefied natural gas (LNG) industry, such as LNG floating production, storage, and off-loading (LNG-FPSO), and LNG flare gas recovery units (LNG-FGRUs). The membrane container is of a prismatic shape and is popular in the industry because of its high cargo volume, manufacturing convenience, and clear visibility when compared to the moss container. However, the prismatic structure is vulnerable to sloshing phenomena. Sloshing phenomena cause various engineering issues such as stress concentration, reduced steering performance, and accelerating boil-off gas (BOG) due to increased free surface area.
Recently, the main engine electronic control gas injection (ME-GI) engine and extra-long-stroke dual-fuel (X-DF) engine were developed to reduce the economic loss due to BOG, which is expected to increase partially filled voyages. Hence, it is important to consider the assessment of sloshing loads as a safety measure when designing LNG containers. To address this issue of assessing sloshing loads, Det Norske Veritas (DNV) [1] and Bureau Veritas [2] provide guidelines on the assessment of sloshing loads for safety design of membrane tanks. The equation of resonance period in the guidelines is related only to simple rectangular [3] shapes; the structural information of chamfered (prismatic) shapes is not considered.
Many numerical studies on the analysis of sloshing phenomena have been performed. Kim [4] studied the numerical simulation of sloshing flows to predict sloshing impact loads, and provided a good summary of various numerical approach techniques. The volume-of-fraction (VOF) method, suggested by Hirt and Nichols [5], is employed by many researchers. Loots et al. [6] proposed an improved VOF (iVOF) method to analyze LNG sloshing phenomena; the results showed good agreement with experimental pressure pulse data when fluid collides with the wall surface. Rhee [7] studied numerical uncertainties in sloshing phenomena using VOF methods; the results showed that 3D effects of sloshing are not significant. Lee et al. [8] reported the sensitivity of dimensionless parameters by both experiment and a commercial computational fluid dynamics (CFD) software solution. Rognebakke and Faltinsen [9] studied the roof effects of a prismatic tank, both theoretically and experimentally. Godderidge et al. [10] numerically analyzed the sloshing impacts of a chamfered roof angle under roll and sway motions with an intermediate filling rate.
In this numerical study, the intermediate filling rate was considered and the VOF method was used for modeling sloshing phenomena. The numerical model was verified in comparison with an analytical solution. The effects of the natural frequencies of the rectangular and prismatic tanks were analyzed through time series of the pressure values using the correlation proposed by Faltisen and Timokha [11][12].
2. Computational Modeling
2.1 Modeling of prismatic tank
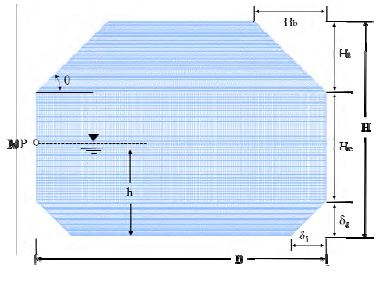
Figure 1 shows the hexagonal 2D mesh region and geometric variables of a prismatic tank for sloshing simulation. Here, MP denotes the measurement point of pressure, which is located at height H/2. H is the height of the tank. Ht and Hc are 300 mm and 450 mm, respectively. Hb = Ht. h = 450 mm is the filling level with a 50% filling ratio. B = 1200 mm is the length of free surface. θ = 45° is the roof angle. δ1 and δ2 are, respectively, the width and height of the chamfered bottom corners. Here, δ2 = 150 mm, and δ1 = 50 mm, 150 mm, and 250 mm are the geometrical parameters used for the cases in this study. Meshes are generated by commercial software (ICEM CFD). The mesh region consists of approximately 95,000 elements and 64,000 nodes.
2.2 Analysis and Boundary conditions
2D sloshing simulation was performed by commercial software ANSYS CFX. The VOF method was used for performing multi-phase flow between water and air. The prismatic tank was excited by a sinusoidal wave. The equation is given by
| (1) |
where A = 0.3 m is amplitude, t is time, and ω = ωn and ω´n are the shaking frequencies. Here, ω´n is the natural frequency of a simple rectangular tank [3] and ω´n is the natural frequency of the prismatic tank [11][12]. Equation (2) is for the lower chamfered tank case. The nth natural frequency correlation is given by:
| (2) |
| (3) |
where, kn=nπ/B is the wave number. g is the gravitational acceleration. The sloshing phenomena were analyzed considering an unsteady simulation for 0 to 20 s and for a tank that moves in a horizontal direction only for each case. The density of air and water are 1.185 kg/m3 and 998 kg/m3, respectively. The time increment Δt is 0.01s.
2.3 Sloshing simulation parameters
This study focused on the influence of natural frequencies to impact pressure on the prismatic tank wall. A total of six cases were considered, as shown in Table 1. Here, ω′1 is the first-order natural frequency of the prismatic tank, and ω1 is first-order natural frequency of a simple rectangular tank. δ1 is a vital geometric parameter to determine the natural frequency and in calculating ω´n. The impact pressure should be compared with the same δ1, such as in case 1 and case 4.
2.4 Governing equations
The VOF method was adopted to model the free surface and sloshing in a 2D tank excited by horizontal motion. Godderidge et al. [13] illustrated that the inhomogeneous multi-phase model is the most appropriate one to use for violent sloshing problems. Hence, the VOF method based on the inhomogeneous model was used in this study.
The total volume fraction is given by
| (4) |
The conservation equation for incompressibility between phases is given by
| (5) |
The continuity equation is given by
| (6) |
The momentum equation is given by
| (7) |
where α and β are the phases, r is a fixed minimum volume fraction, U is velocity, ρ is density, p is pressure, and i,j represents tensor. The presence of the third term in the right side of Equation (7) is the factor that distinguishes between the homogeneous and inhomogeneous model. Г+ indicates the positive mass flow rate per unit volume; Гαβ is given by
| (8) |
Here, is the mass flow rate per unit interfacial area from phases α and β. Aαβ is proportional to volume fraction density. The free surface model is given by
| (9) |
3. Results and Discussions
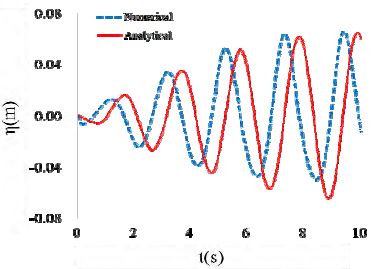
This comparative study was performed to ensure the reasonability of computed wave elevation on the tank wall and to validate the numerical model. The linear analytical solutions are based on potential flow theory, established by Faltinsen [14]. It is widely used for validating numerical models of 2D tank sloshing problems under horizontally excited motions; this was done by Liu [15] and. Frandsen [16]. The numerical result of the free surface elevation in a horizontally excited tank was compared with the analytical result. This study considered a simple rectangular tank with small amplitude (A = 0.01 m). The tank had a 0.5 m filling height, 2 m length, and 1 m height. The water viscosity in the numerical model was set to zero to compare with the analytical model. The natural frequency ω1 = 2.86s-1 and water depth = 0.5 m were considered for this study. The free surface elevation η, can be expressed as [14][15]:
| (10) |
where
| (11) |
| (12) |
| (13) |
| (14) |
| (15) |
Figure 2 shows the comparison of the numerical and analytical solutions. The numerical results show good quantitative prediction with the analytical results in spite of a phase shift and increasing discrepancy of the values. The potential theory assumes inviscid and irrotational flow, whereas the VOF numerical model considers complex physical conditions such as drag force, surface tension, and wall condition. The phase shift phenomena and increasing discrepancy are due to the effect of fluid inertia in the numerical model.
The calculated pressure data at MP are shown in Figure 3; the previous study [17] was conducted to ensure the reliability of calculated pressure peak values. Six cases of δ1 were compared with that of their respective natural frequencies. In Figure 3(a), for case 1, the average of pressure peak value is 22% higher than that of case 4. In Figure 3(b) and Figure 3(c), the average of pressure peak value is 58% and 84% lower, respectively, when compared to cases 5 and 6, when the simple rectangular natural frequency is applied. This shows that when the frequency decreases, the excitation velocity also gradually decreases.
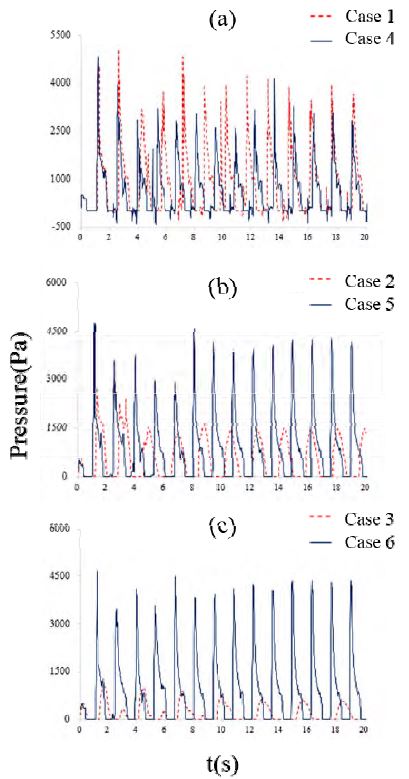
Time series of pressure loads on the prismatic tank wall, (a) δ1 = 50mm,(b) δ1 = 150mm,(c) δ1 = 250mm
Moreover, the results of Figure 3(a) show that the magnitude of the resonance effect (red dashed line) is higher than that of the simple rectangular natural frequency (blue line) case. That is, for the δ1 = 50 mm chamfered case, the effect of the resonance magnitude was high on the prismatic tank natural frequency, even though the excitation of the tank velocity decreased.
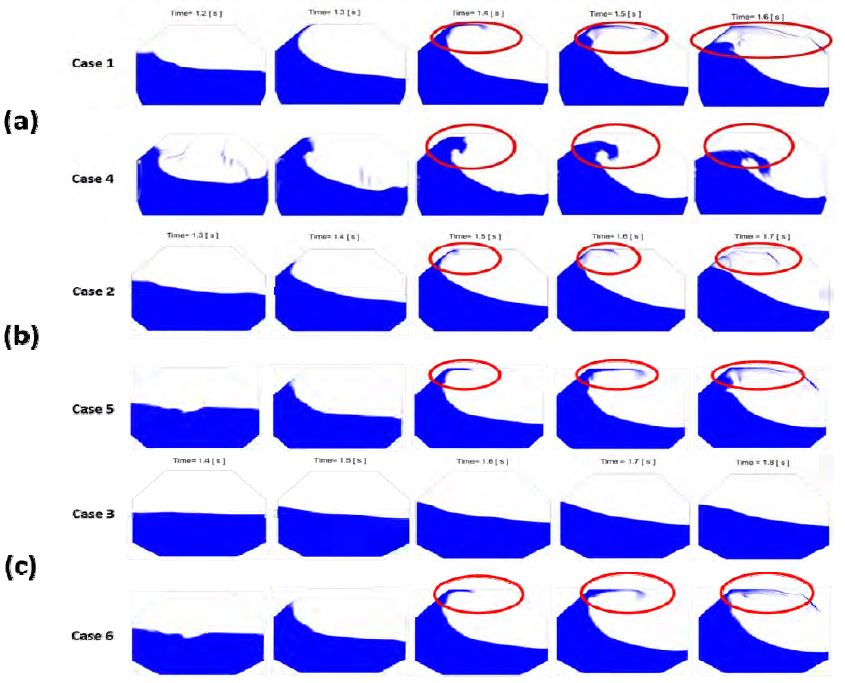
Figure 4 shows the visualization of sloshing behavior in a prismatic tank for each case in time history. In case 1 and case 2, it can be observed that the sloshing waves broke along the roof and the pressure values were proportional to the increasing non-linearity of the free surface. Case 3 shows the sloshing flow without its wave breaking. Case 1 created more hydraulic jump than case 4 because of the effect of the prismatic tank’s natural frequency. Cases 5 and 6 created more hydraulic jump than cases 2 and 3, respectively, because of the higher frequency effects. In case 3, sloshing wave breaking (or turnover) phenomena were not observed because of the low frequency. Hence, the Wagner type pressure form [18] is observed in Figure 3(c). With this form and considering the pressure signal of case 2 (Figure 3), the sloshing phenomena occurred violently from 0.5 to 5 s, after which the violent sloshing waves slowly become stable sloshing waves.
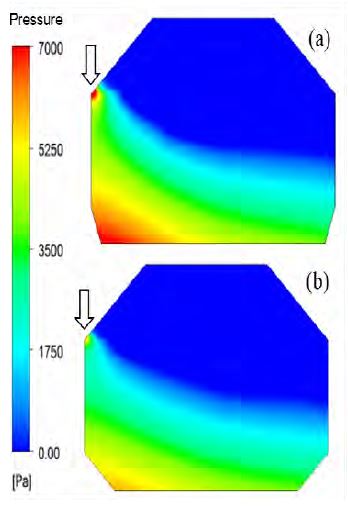
Figure 5(a) and Figure 5(b) show the temporary pressure contour in the prismatic tank. The concentration of sloshing loads at the corner of the tank walls can be clearly seen. This phenomenon could not be seen in case 3 of Fig. 4 because of the small free surface elevation. Hence, it can be seen that the concentration of sloshing loads depends on the non-linearity of sloshing flow.
4. Conclusion
The CFD technique based on the VOF method was applied for simulating sloshing flow in a prismatic tank. A total of six cases were simulated to compare the effects of the natural frequencies of a prismatic tank and a rectangular tank. From the results of the six cases, the following conclusions were made: First, the numerical model showed good agreement with the analytical solution. In particular, the phase shift problem occurred because of the fluid inertia. Second, the pressure peak values of case 1 were higher than those of case 4. In addition, the concentration of sloshing loads at the corner of the wall depended on the non-linearity of sloshing flow, as was visually observed.
Acknowledgments
This paper is the modified version of the papers presented at the 6th AJWTF and the 40th KOSME fall conference. The two first authors contributed equally in the making of this paper. And this work was supported by a Research Grant of Pukyong National University(2015 year).
References
- Det Norske Veritas, Sloshing Analysis of LNG Membrane Tanks, DNV Classifications Notes, no. 30.9, (2014).
- Breau Veritas, Design sloshing loads for LNG Membrane Tanks, Breau Veritas Guidance Note, NI 554 DT R00 E, (2011).
-
D. W. Fox, and J. R. Kuttler, “Sloshing Frequencies”, Zeitschrift für angewandte Mathematik und Physik ZAMP, vol. 34(no. 5), p668-696, (1983).
[https://doi.org/10.1007/bf00948809]

-
Y. Kim, “Numerical simulation of sloshing flows with impact load”, Applied Ocean Research, vol. 23(no. 1), p53-62, (2001).
[https://doi.org/10.1016/s0141-1187(00)00021-3]

-
C. W. Hirt, and B. D. Nichols, “Volume of fluid (VOF) method for the dynamics of free boundaries”, Journal of Computational Physics, vol. 39(no. 1), p201-225, (1981).
[https://doi.org/10.1016/0021-9991(81)90145-5]

- E. Loots, B. Buchner, W. Pastoor, and T. Tveitnes, “The numerical simulation of LNG sloshing with an improved volume of fluid method,”, ASME 2004 23rd International Conference on Offshore Mechanics and Arctic Engineering, (2004).
-
S. H. Rhee, “Unstructured grid based Reynolds-averaged Navier-Stokes method for liquid tank sloshing”, Journal of Fluids Engineering, vol. 127(no. 3), p572-582, (2005).
[https://doi.org/10.1115/1.1906267]

-
D. H. Lee, M. H. Kim, S. H. Kwon, J. W. Kim, and Y. B. Lee, “A parametric sensitivity study on LNG tank sloshing loads by numreical simulations”, Ocean Engineering, vol. 34(no. 1), p3-9, (2007).
[https://doi.org/10.1016/j.oceaneng.2006.03.014]

- O. F. Rognebakke, and O. M. Faltinsen, “Damping of sloshing due to tank roof impact”, 15th International Workshop on Water Waves and Floating Bodies, (2000).
- G. Bernhard, S. R. Turnock, and M. Tan, “Evaluation of a rapid method for the simulation of sloshing in rectangular and octogonal containers at intermediate filling levels”, Computers and Fluids, vol. 57, p1-24, (2001).
- O. M. Faltinsen, and A. N. Timokha, “An adaptive multimodal approach to nonlinear sloshing in a rectangular tank”, Journal of Fluid Mechanics, vol. 432, p167-200, (2001).
-
O. M. Faltinsen, and A. N. Timokha, “Analytically approximate natural sloshing modes and frequencies in two-dimensional tanks”, European Journal of Mechanics-B/Fluids, vol. 47, p176-187, (2014).
[https://doi.org/10.1016/j.euromechflu.2014.01.005]

- G. Bernhard, S. R. Turnock, M. Tan, and C. Earl, “An investigation of multiphase CFD modeling of a lateral sloshing tank”, Computers and Fluids, vol. 38(no. 2), p183-193, (2009).
- O. M. Faltinsen, “A numerical non-linear method for sloshing in tanks with two dimensional flow”, Journal of Ship Research, vol. 18(no. 4), p224-241, (1978).
-
D. Liu, and P. Lin, “A numerical study of three-dimensional liquid sloshing in tanks”, Journal of Computational Physics, vol. 227(no. 8), p3921-3939, (2008).
[https://doi.org/10.1016/j.jcp.2007.12.006]

-
B. J. Frandsen, “Sloshing motions in excited tanks”, Journal of Computational Physics, vol. 196(no. 1), p53-87, (2004).
[https://doi.org/10.1016/j.jcp.2003.10.031]

- H. J. Kim, Numerical Study for Motion of an Ocean Floater with Sloshing Effects, M.S. Thesis, Graduate School, Pukyong National University, Korea, (2014), (in Korean).
- T. Gregory, Handbook of Port and Harbor Engineering, Geo-technical and Structural Aspects, Springer, (2014).

