
Effect of pressure on ammonia conversion in urea-water solution spray under high-pressure conditions

Copyright © The Korean Society of Marine Engineering
This is an Open Access article distributed under the terms of the Creative Commons Attribution Non-Commercial License (http://creativecommons.org/licenses/by-nc/3.0), which permits unrestricted non-commercial use, distribution, and reproduction in any medium, provided the original work is properly cited.
Abstract
This study numerically investigated the effect of pressure on urea–water solution (UWS) evaporation, decomposition, and ammonia (NH3) conversion efficiency in diesel engine aftertreatment systems. Previous studies have mainly focused on droplet evaporation, urea thermolysis, and spray simulations under atmospheric conditions, while the influence of pressure has received limited attention. In this study, a rapid mixing (RM) based spray simulation model was employed and stepwise validated against the single droplet experiments of Wang et al. and the in-duct spray experiments of Kim et al. under atmospheric pressure conditions. To account for high-pressure effects, the Poynting correction and gas-phase fugacity coefficient were incorporated into the evaluation of surface partial pressure. Based on this model, the evaporation behavior and NH3 conversion characteristics of UWS were numerically predicted over an absolute pressure range of 1-45 bar. The results showed that NH3 conversion efficiency decreased slightly with increasing pressure, from 60.26% at 1 bar to 59.20% at 45 bar, and that the pressure effect became weaker at higher pressures. Under a given pressure, inlet temperature and residence time were the dominant factors governing NH3 conversion efficiency. These findings provide a preliminary reference for understanding NH3 conversion behavior under high-temperature and high-pressure conditions and for designing related NH3 generation systems. Because direct high-pressure validation data were not available, the high-pressure results should be interpreted as numerical predictions rather than fully validated quantitative data.
Keywords:
Urea-water solution, Ammonia, High-pressure, Spray evaporation, Numerical simulation1. Introduction
As NOx emission and greenhouse gas regulations continue to tighten, the development of effective technologies for reducing NOx emissions from diesel engine exhaust has become increasingly important. Among the available aftertreatment technologies, selective catalytic reduction (SCR) has been widely adopted for NOx control in automotive and marine diesel engines. In SCR systems, NH3 reacts with NOx over the catalyst surface to form nitrogen (N2) and water (H2O). However, because NH3 is toxic and corrosive, its direct storage and handling are impractical. Therefore, commercial SCR systems generally use a UWS containing 32.5 wt% urea as an NH3 precursor and carrier. When UWS is injected into a hot exhaust stream, NH3 is produced through sequential water evaporation, urea thermolysis, and hydrolysis of isocyanic acid (HNCO) [1]-[3].
The evaporation and reaction behavior of UWS droplets in SCR systems involve coupled multiphase flow, heat transfer, mass transfer, and chemical reactions. To clarify the evaporation and decomposition characteristics of UWS droplets, previous studies have conducted experimental and numerical investigations of both single droplet and spray droplets. Early studies mainly focused on understanding the basic features of droplet heating and evaporation. For example, Wang et al. [4], Wei et al. [5], and Kontin et al. [6] quantitatively investigated the evaporation behavior of single droplets and reported the time dependent evolution of droplet temperature and evaporation behavior. The evaporation behavior of UWS droplets can be broadly divided into two stages. The first stage is dominated by water evaporation, whereas the second stage is associated with urea depletion and vaporization after most of the water has evaporated, and becomes evident when the ambient temperature exceeds approximately 406 K [7]. These single droplet studies provided the basis for subsequent numerical modeling of UWS sprays, and the scope of later research expanded to more complex configurations, including in-duct spray transport and reaction analysis.
Kim et al. applied the discrete phase model (DPM) to simulate UWS injection and mixing in a hot air stream and adopted a single rate kinetic model to describe NH3 formation from urea decomposition. Comparison with experimental results showed that the model could reasonably predict NH3 formation under different gas temperature and flow conditions [8]. Using the experimental data reported by Kim et al., Shirodkar [9] tuned an Arrhenius type model for urea depletion during thermolysis and compared several liquid-phase models. On this basis, a numerical model was developed for predicting droplet heating, evaporation, urea decomposition, and HNCO hydrolysis. The model reproduced droplet heating and evaporation behavior with reasonable agreement and also provided acceptable predictions of NH3 conversion efficiency.
Building on these earlier studies, multicomponent evaporation models such as the rapid mixing (RM) model and the diffusion limited (DL) model were subsequently introduced. When implemented in computational fluid dynamics (CFD), these models enable the coupled heat and mass transfer processes within the droplet and at the droplet gas interface to be described systematically. In particular, the RM model does not require spatial discretization inside the droplet and has therefore been widely used as a practical and computationally efficient approach [10]. Overall, previous studies have established the basis for modeling UWS evaporation and decomposition under high-temperature conditions. However, because most of these studies were conducted at or near atmospheric pressure, investigations of UWS evaporation and NH3 formation under high-pressure conditions remain limited.
In the present study, numerical simulations were performed based on the experimental conditions reported by Kim et al., with pressure treated as an independent variable, to examine the evaporation behavior of UWS droplets and the corresponding changes in NH3 conversion efficiency under high-pressure conditions. The pressure range of 1–45 bar was not intended to represent conventional exhaust-line SCR operating pressures. Instead, 1 bar was used as the atmospheric pressure baseline for model validation, whereas the elevated-pressure cases of 15, 30, and 45 bar were selected to examine pressure effects relevant to high-pressure ammonia-related systems and marine ammonia fuel system design considerations. MSC.1/Circ.1687 is considered only as a practical design background for ammonia fuel piping, while the present numerical analysis focuses on the pressure-dependent evaporation and NH3 conversion behavior of UWS. Therefore, the present results are not intended to determine the design pressure of ammonia fuel piping, but to provide supplementary physical insight into how operating pressure affects UWS evaporation and NH3 formation. The expected pressure effect can be summarized as follows. As pressure increases, the gas phase mole fractions of evaporating species at the droplet surface are diluted, and the gas phase diffusivity decreases, thereby weakening mass transfer across the liquid gas interface. As a result, the droplet evaporation rate is expected to decrease, while the overall evaporation time increases. In addition, although the equilibrium vapor pressure at the droplet surface is governed mainly by temperature and liquid-phase composition, high-pressure thermodynamic effects may alter the phase equilibrium at the droplet surface and thus modify the surface vapor pressure. Therefore, increasing pressure is expected to suppress UWS evaporation and, consequently, reduce NH3 conversion efficiency. It should be noted that the high-pressure cases were not directly validated against high-pressure experimental data and are therefore discussed as numerical predictions.
2. Numerical Method
In this study, the spray behavior of UWS was simulated using the commercial CFD code ANSYS Fluent. An Eulerian–Lagrangian approach was employed, in which air was treated as the continuous phase and UWS droplets were treated as the discrete phase. The droplet behavior was calculated using the discrete phase model (DPM), and the droplets were tracked in the Lagrangian frame in terms of their trajectories and changes in temperature and composition during evaporation. Two-way coupling was considered so that the exchange of mass, momentum, and energy between the droplets and the gas phase was incorporated into the governing equations of the continuous phase. The heat and mass transfer processes of multicomponent droplets were modeled using a user defined function (UDF), and the droplets were assumed to be spherical. In addition, urea decomposition was treated as a volumetric reaction in the gas phase.
The single droplet evaporation calculations were performed under quiescent conditions, and the surrounding air was treated as laminar. For the in-duct UWS spray simulations based on the experimental conditions of Kim et al., the continuous phase was solved using a transient pressure-based solver with the PISO pressure–velocity coupling algorithm. Turbulence was modeled using the realizable k−ε model with scalable wall functions. The PRESTO! scheme was used for pressure discretization. First-order upwind discretization was used for turbulent kinetic energy and turbulent dissipation rate, whereas second-order upwind discretization was used for density, momentum, energy, and species transport equations. The residual convergence criterion was set to 10−6 at each time step. Unless otherwise stated, all pressure values reported in the present simulations are absolute pressures. The pressure used in the evaporation model, including the Poynting correction and fugacity coefficient calculation, also refers to the local absolute pressure.
The computational domain was based on the straight duct configuration shown in Figure 1, with an inner diameter of 0.30 m and a length of 6.2 m. The relative locations of the injector and the sampling positions (A–C) were kept the same as those shown in Figure 1. The average mesh size was approximately 19 mm. The computational mesh consisted of hexahedral cells with a nearly uniform mesh distribution in the duct. After validation of the model, additional calculations were performed by varying only the ambient pressure while keeping the spray conditions and all other boundary conditions unchanged, in order to predict the variation of NH3 conversion efficiency with pressure.
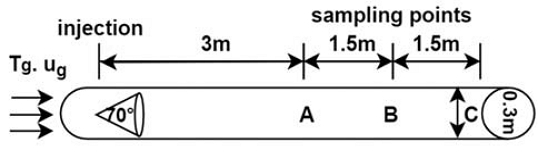
Schematic of the experimental setup used by Kim et al.
A grid sensitivity check was performed for the in-duct spray case of Tin = 623 K and Vin = 9.1 m/s. Six average grid sizes of 9, 12, 13, 14, 19, and 21 mm were tested. The temperature history was monitored at a point located 100 mm downstream of the injection position on the spray centerline. As shown in Figure 2, the overall temperature histories predicted using different grid sizes were similar, and the difference after the initial cooling period was small. Considering both numerical accuracy and computational cost, the average grid size of 19 mm was selected for the validation and pressure effect calculations.
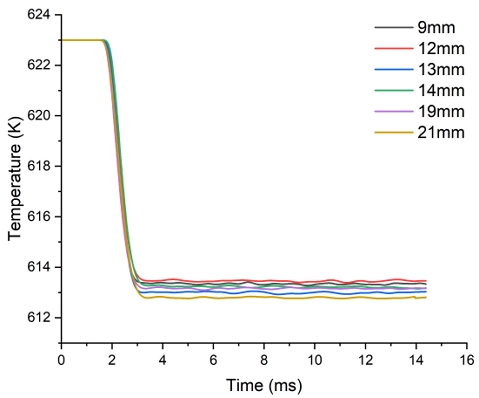
Grid sensitivity check based on the temperature history at the monitoring point 100 mm downstream of the injection location (Tin = 623 K, Vin = 9.1 m/s)
After the final grid was selected, the time step was chosen based on the CFL condition and was set to 1.0 × 10⁻⁵ s. For the selected 19 mm mesh, each in-duct spray simulation required approximately 132 CPU hours using 30 processor cores.
Under high-temperature conditions, a UWS droplet is initially heated, and water evaporation begins when the droplet temperature approaches the saturation temperature of water at the prevailing pressure. As water evaporates, the urea mass fraction in the droplet gradually increases, and urea vaporization and depletion become increasingly important. Previous studies have reported that, at approximately 673 K, the difference between the RM model and the DL model predictions is small [11]. In contrast, Abu-Ramadan et al. [12] showed that diffusion limited effects become more important at lower temperatures and for larger droplets, suggesting that the applicability of the RM model may be more limited under such conditions.
In the present study, the RM model was adopted to improve computational efficiency and to focus on the effect of pressure. In the RM model, heat and mass diffusion inside the droplet are assumed to be sufficiently fast compared with the corresponding transfer processes at the droplet surface. Accordingly, the droplet temperature and the mass fraction of each component are assumed to be uniform throughout the droplet at a given time. Under this assumption, the evaporation of a multicomponent droplet can be described using a single overall mass conservation equation and a single overall energy conservation equation for the entire droplet. At elevated pressures, the decrease in gas phase diffusivity and evaporation rate may increase internal temperature and concentration gradients within the droplet. This effect may become more important in the later stage of evaporation, when the urea concentration becomes high. Therefore, the RM-based high-pressure results should be understood as predictions obtained under the uniform-temperature and uniform-composition droplet assumption.
2.1 Evaporation of a Multicomponent Droplet
In the present study, the binary RM evaporation model for UWS droplets proposed by Mikhil et al. [13] was employed. Film theory was used to describe the convective heat and mass transfer in the gas film surrounding the droplet. Accordingly, the total evaporation rate of a UWS droplet is given by Equation (1).
| (1) |
Equation (1) describes the droplet surface mass transfer process for a multicomponent droplet. The binary diffusivityDv,i was evaluated using Fuller’s method and updated at each time step to account for the local temperature and pressure. In this way, the effects of temperature and pressure on diffusion were taken into account [14].
The Spalding mass transfer number is given by Equation (2).
| (2) |
The vapor mass fraction of species i at the droplet surface was determined from the corresponding surface partial pressure obtained from vapor liquid equilibrium. Therefore, accurate evaluation of Pi,s is important for reliable prediction of the evaporation behavior.
The partial vapor pressure was evaluated based on the thermodynamic equilibrium between the liquid and gas phases. In this study, instantaneous phase equilibrium was assumed at the droplet surface, and the equilibrium condition was applied to each species [15]. Accordingly, the surface partial pressure of species i was expressed using activity corrected Raoult’s law as .
For dilute solutions, γi was set to unity, and the relation reduces to Raoult’s law for an ideal solution. At high urea concentrations, γi was evaluated using the NRTL model to account for liquid-phase non-ideality and thereby improve the prediction of surface partial pressure. In addition, to reflect the pressure dependence of the liquid-phase chemical potential under high-pressure conditions, the phase equilibrium relation was corrected by introducing the Poynting factor [16]. The Poynting factor for species 𝑖 is given by Equation (3).
| (3) |
In the present calculation, the surface partial pressure was evaluated in the following order. First, the activity-corrected Raoult’s law was used to calculate γiXiPi,sat. Second, the Poynting factor was applied to account for the pressure effect on the liquid-phase chemical potential. Finally, the gas phase fugacity coefficient was applied to correct vapor-phase non-ideality. Therefore, the corrected surface partial pressure was expressed as shown in Equation (4).
| (4) |
where Πi is the Poynting factor and ∅i is the gas phase fugacity coefficient. In the present calculation, the Poynting correction was applied to both water and urea. The fugacity coefficient of water vapor was evaluated using the Peng–Robinson equation of state, whereas urea vapor was treated as ideal in the gas phase ( ∅u = 1) because the critical-property parameters required for the Peng–Robinson equation of state were not adopted for urea vapor in the present model.
For water vapor, the Peng–Robinson equation of state was solved in terms of the compressibility factor Z, and the vapor root was used to calculate ∅w. The cubic equation was written as shown in Equation (5).
| (5) |
where
The vapor root of the cubic equation was used to calculate the water fugacity coefficient, as shown in Equation (6).
| (6) |
where Z is the compressibility factor, A and B are the Peng–Robinson equation parameters, and a and b are the attraction and co-volume parameters, respectively. For water vapor, the critical temperature and critical pressure used in the calculation were Tc = 647.09 K, and Pc = 22.06 MPa, respectively [17].
The activity coefficients of water and urea were calculated using the binary NRTL model. The interaction parameter was expressed as shown in Equation (7).
| (7) |
where
where τ is the NRTL interaction parameter, G is the NRTL exponential term, and a, b, c, and α are the NRTL binary interaction constants. The values used in the present calculation are listed in Table 1.

Binary interaction parameters for the NRTL model for UWS.
To ensure consistent evaluation of thermophysical properties in the vapor film, the one third rule proposed by Abramzon and Sirignano was adopted for the evaluation of film properties. In addition, modified Sherwood and Nusselt numbers, together with the Stefan flow correction factors, were used to account for the effect of Stefan flow on heat and mass transfer. In the droplet energy balance [18], part of the heat transferred from the hot gas to the droplet contributes to sensible heating of the droplet, while the remainder is consumed as the latent heat of multicomponent vaporization. Under the RM assumption, the net heat transfer rate to the droplet is given by Equation (8).
| (8) |
2.2 Thermolysis and Hydrolysis
When UWS spray is injected into a hot gas stream, urea begins to melt at around 406 K, and the presence of a small amount of urea vapor has also been reported near this temperature [19]-[21]. As the temperature approaches 413 K, vaporization of molten urea becomes appreciable [22], and the associated latent heat of vaporization is about 87.4 kJ/mol. At temperatures above approximately 425 K, gaseous urea undergoes thermolysis to form NH3 and HNCO [22][23]. This thermolysis process is endothermic, with a reaction enthalpy of about 98.1 kJ/mol, and may therefore reduce the local gas phase temperature. The thermolysis rate is given by Equation (9) [20].
| (9) |
According to Schaber et al. [7], HNCO hydrolysis occurs at around 548 K, and the corresponding rate constant used in this study follows the expression proposed by Birkhold et al. [24].The hydrolysis of HNCO is an exothermic reaction, with a reported reaction enthalpy of approximately −96 kJ/mol [25]. The hydrolysis rate is given by Equation (10).
| (10) |
In the present study, only the main gas phase reactions, namely urea thermolysis and HNCO hydrolysis, were included to predict NH3 formation. Other possible urea decomposition pathways and intermediate species, such as biuret, cyanuric acid, ammelide, ammeline, and melamine, were not considered. These simplifications may affect the predicted NH3 conversion efficiency when secondary reactions or intermediate-species formation becomes important. Therefore, the present chemistry model should be regarded as a simplified reaction model for estimating the main NH3 formation trend in the duct.
3. Model Validation and Simulation Conditions
Validation of the present numerical model was carried out in two stages. First, for the evaporation of a single multicomponent UWS droplet, the time variation of droplet diameter predicted by the RM model was compared with the single droplet experimental data reported by Wang et al. to assess the applicability of the RM model. Second, for the evaporation and decomposition of UWS spray in a duct, the predicted NH3 conversion efficiency was compared with the spray experimental data of Kim et al., thereby evaluating the ability of the present model to predict NH3 conversion efficiency under spray conditions. To quantify the agreement between the numerical and experimental results, the root mean square error (RMSE) was calculated for both the single droplet evaporation and the in-duct NH3 conversion results. For the single droplet evaporation validation, the RMSE was calculated using at the experimental data points along the evaporation history. For the in-duct spray validation, the RMSE was calculated using the NH3 conversion efficiency at the sampling locations reported by Kim et al. The RMSE is given by Equation (11).
| (11) |
where N is the number of experimental data points. For the single droplet evaporation validation, φ denotes , whereas for the in-duct NH3 conversion validation, φ denotes ηNH3.
3.1 Single Multicomponent Droplet
Wang et al. reported the time variation of droplet diameter for a single UWS droplet with a urea mass fraction of 32.5% in a quiescent gaseous environment. In the present study, the three representative experimental cases summarized in Table 2 were used as the input conditions for single droplet validation. The numerical model predicted the time variation of droplet diameter under each ambient temperature condition, and the predictions were compared with the experimental data to evaluate the applicability of the RM model.
Initial droplet diameter and ambient conditions for single droplet evaporation
3.2 Spray of Multicomponent Droplets
Kim et al. reported experimental data on NH3 conversion efficiency for UWS containing 40 wt% urea injected into a straight duct under different inlet air temperature and velocity conditions. In the present study, three representative inlet air temperature and velocity conditions from the experimental cases of Kim et al., summarized in Table 3, were applied as boundary conditions. The inlet boundary was specified using the air temperature and velocity listed in Table 3, and the outlet was treated as a pressure outlet. The duct wall was treated as a no-slip and adiabatic wall because the spray visualization results of Kim et al. showed no apparent spray-wall impingement under the present injection condition. The spray conditions were also based on those reported by Kim et al. The injection pressure was set to 3 bar, and the remaining spray parameters were specified according to the conditions listed in Table 4.
Simulation cases with different inlet air temperatures and velocities
Spray parameters and droplet characteristics used for DPM injection
The spray was modeled as a hollow cone consisting of six particle streams. The Rosin–Rammler droplet size distribution was prescribed using the characteristic diameter 44 μm, spread parameter 3.27, and a number of diameters of 10, as listed in Table 4. These settings define the representative DPM injection groups used in the in-duct spray simulation. The TAB breakup model was used to describe secondary droplet breakup during spray development. Droplet collision and coalescence were not considered in the present calculation. In addition, spray-wall interaction was not modeled because the spray visualization results reported by Kim et al. showed that the UWS spray developed mainly in the central region of the duct under the present injection condition, and wall impingement was not expected to be dominant. Therefore, the present spray model focuses on spray evaporation, gas phase transport, and NH3 formation rather than wall-film formation or deposit behavior. Based on these conditions, numerical simulations were performed for UWS spray evaporation, gas phase urea thermolysis, and HNCO hydrolysis in the duct. The predicted NH3 conversion efficiency was then compared with the experimental values to validate the numerical model for predicting NH3 conversion efficiency under UWS spray conditions.
3.3 Pressure Effect Simulation Cases
After validating the RM model and the spray simulation model through comparisons with single droplet UWS evaporation and NH3 conversion efficiency under UWS spray conditions, the effect of pressure on NH3 conversion efficiency was evaluated by varying only the pressure while keeping the air temperature, inlet velocity, and spray conditions unchanged. Table 5 summarizes the three representative pressure conditions considered in this study. Together with the atmospheric pressure validation case, the pressure range considered in this study was therefore 1–45 bar. The 1 bar condition represents the atmospheric pressure validation baseline based on the experiments of Wang et al. and Kim et al., whereas 15, 30, and 45 bar were selected as representative elevated-pressure levels to examine the sensitivity of UWS evaporation and NH3 conversion efficiency to pressure. This pressure range should not be interpreted as a typical exhaust-line SCR operating range, but rather as a parametric range selected to support the analysis of high-pressure NH3 generation behavior under ammonia-related marine system conditions. These additional calculations were performed to clarify the overall influence of elevated pressure on NH3 conversion efficiency and to provide a preliminary reference for the design and optimization of NH3 generation systems. Because the validation data used in this study were obtained under atmospheric pressure conditions, the elevated-pressure cases should be regarded as numerical predictions based on the present model, rather than fully validated high-pressure results.
Simulation cases with different inlet absolute pressures (Tin = 673 K, Vin = 10.8 m/s)
For the elevated-pressure cases, the same initial spray conditions, Rosin–Rammler droplet size distribution, and TAB secondary breakup model were used as in the atmospheric-pressure validation case. Thus, the predicted pressure effect mainly reflects the influence of pressure on vapor–liquid equilibrium, gas-phase diffusivity, and heat and mass transfer under fixed initial spray conditions. Possible pressure-induced changes in primary atomization, droplet collision and coalescence, spray dispersion, wall impingement, crystallization, and deposit formation were not explicitly considered. These processes may alter the droplet size distribution and effective spray surface area under actual high-pressure conditions. Finer atomization or enhanced breakup could promote UWS evaporation and NH3 formation, whereas coalescence, larger droplets, wall-film formation, or deposit formation could delay evaporation and reduce NH3 conversion. Therefore, the elevated-pressure results should be interpreted as predicted trends under the present fixed-spray and simplified interaction assumptions.
4. Results and Discussion
Based on the experimental data reported by Wang et al., the evaporation of a single UWS droplet was numerically analyzed and compared with the measurements. Figure 3 shows the time history of the normalized squared diameter, , as a function of the diameter-normalized time, , at 573, 623, and 673 K. The use of follows the classical D2-law scaling for droplet evaporation, in which the evaporation time scale is proportional to the square of the initial droplet diameter. This scaling reduces the influence of different initial droplet sizes and is commonly used in previous UWS single droplet evaporation studies for comparing evaporation histories. Over this temperature range, the evaporation of a UWS droplet can be divided into two stages. In the initial stage, water evaporation is dominant because of the high-water content, and the droplet diameter decreases rapidly. After most of the water has evaporated, the overall evaporation rate decreases markedly as the urea concentration increases.
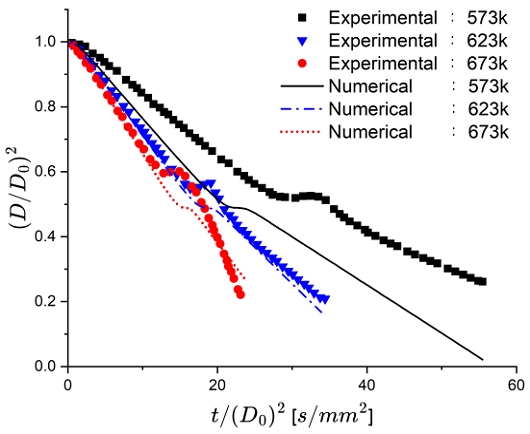
Time histories of normalized squared diameter D2/D02 plotted against diameter-normalized time t/D02 for an evaporating UWS droplet at different ambient temperatures
At 623 and 673 K, the numerical results are in reasonable agreement with the experimentally observed variation in droplet diameter. The RMSE values of were 0.1280, 0.0294, and 0.0404 at 573, 623, and 673 K, respectively. As the ambient temperature decreases, the onset of substantial urea evaporation is delayed, and the model still captures the overall trend in diameter variation reasonably well. In contrast, at 573 K, the discrepancy between the numerical prediction and the experimental data is relatively large in the initial stage. This is also reflected in the relatively larger RMSE at 573 K. This result suggests that internal temperature and species concentration gradients may become more important in this temperature range, thereby reducing the applicability of the RM model, which assumes uniform temperature and species concentration within the droplet.
The applicability of the numerical model to predicting NH3 conversion efficiency was then evaluated by comparing the spray simulation results with the experimental data of Kim et al. NH3 conversion efficiency was evaluated using Equation (12) as the ratio of the NH3 molar flow rate through the sampling cross section to the theoretical maximum NH3 molar flow rate. The theoretical maximum NH3 molar flow rate was obtained from the injected urea molar flow rate based on the stoichiometric relation that one mole of urea produces two moles of NH3.
| (12) |
The numerical and experimental results were compared at the same sampling locations (A, B, and C). The residence times corresponding to these sampling locations were taken from the experimental data reported by Kim et al., where NH3 conversion efficiency was measured at the corresponding residence times. Figure 4 shows the NH3 conversion efficiencies predicted under the conditions listed in Tables 3 and 4 together with the experimental data reported by Kim et al. For all three conditions (Tin = 573 K, Vin = 9.0 m/s; Tin = 623 K, Vin = 9.1 m/s; Tin = 673 K, Vin = 10.8 m/s), the NH3 conversion efficiency increases with residence time and, at a given residence time, increases with increasing inlet temperature. Under all three conditions, the numerical results are slightly lower than the experimental values overall. For the NH3 conversion efficiency, the RMSE values were 3.16, 3.15, and 5.02 percentage points at 573, 623, and 673 K, respectively. These values indicate that the present model reproduced the overall NH3 conversion trend with a moderate deviation, although the deviation varied depending on the inlet temperature and residence time.
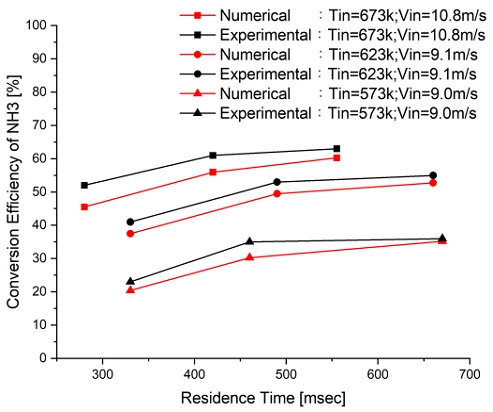
Calculated NH3 conversion efficiency at different inlet gas temperatures and velocities, compared with the experimental data of Kim et al.
These trends are consistent with previous experimental and numerical studies, which showed that NH3 conversion increases with temperature and decreases as residence time is shortened. The underprediction observed at 573 K may be related to the slower UWS evaporation and urea depletion under lower-temperature conditions, where internal temperature and concentration gradients inside the droplet may become more important and weaken the RM assumption. In addition, NH3 formation at 573 K is more sensitive to the kinetic parameters of urea thermolysis and HNCO hydrolysis because the reaction rates are strongly temperature-dependent. Uncertainties in the inlet thermal boundary condition, heat and mass transfer correlations, and spray description may also contribute to the deviation. Further improvement could be achieved by considering more detailed droplet internal transport models, refined reaction kinetics, and additional low-temperature spray validation data.
NH3 conversion efficiency is governed primarily by inlet temperature and residence time, and both urea thermolysis and gas phase HNCO hydrolysis contribute to NH3 formation. Therefore, uncertainties in the rate expressions and associated kinetic parameters for urea thermolysis and HNCO hydrolysis can affect the accuracy of the predicted NH3 conversion efficiency. This is also consistent with previous UWS spray studies, in which thermolysis and hydrolysis were treated as the key gas phase reactions controlling ammonia formation in the duct.
Figure 5 shows the normalized d2 histories, as a function of the normalized time under different ambient pressures. As the ambient absolute pressure increases from 1 bar to 15, 30, and 45 bar, the overall evaporation time of the droplet increases significantly, indicating that the mean evaporation rate decreases with increasing pressure. The largest change occurs as the pressure increases from 1 bar to 15 bar, whereas the differences among the curves at 15, 30, and 45 bar are relatively small. This behavior may be explained by the combined effect of changes in surface partial vapor pressure and the mass transfer driving force with increasing pressure.
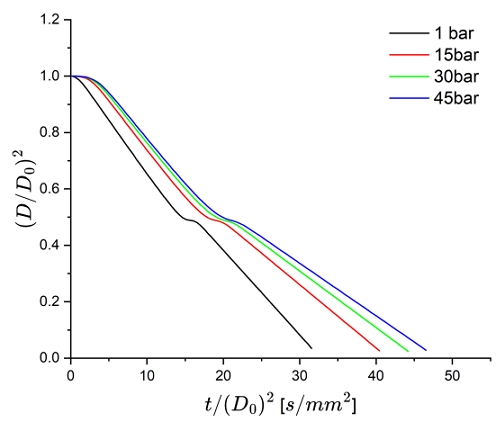
Normalized squared diameter history of an evaporating UWS droplet at 673 K under different ambient absolute pressures
Figure 6 shows the temporal variation in the surface partial pressure Pi,s of each component in a single UWS droplet at different ambient absolute pressures. At a given droplet temperature, Pi,s tends to increase with increasing pressure. However, the increase in Pi,s is smaller than that in the total pressure P∞. Accordingly, under an ideal gas approximation, the gas phase mole fraction of species i at the droplet surface, Xi,v,s = Pi,s/P∞ generally decreases as pressure increases. This relation is quantified in Table 6. Although the surface partial pressures of water and urea increase with increasing ambient absolute pressure, their surface vapor mole fractions decrease because the increase in surface partial pressure is smaller than the increase in the corresponding ambient absolute pressure. For example, as the ambient absolute pressure increases from 1 bar to 45 bar, Xw,v,s decreases from 0.1557 to 0.1209, while Xu,v,s decreases from 0.0977 to 0.0543. As a result, the vapor mass fraction at the droplet surface, Yv,s,i, and the Spalding mass transfer number, BM,i, may decrease, which can reduce the driving term ln(1+BM,i) and contribute to the lower overall evaporation rate predicted by the model. This trend is consistent with the slower UWS evaporation predicted in Figure 5. In addition, as pressure increases, the vapor film density, ρf, increases, whereas the binary diffusivity D generally decreases approximately in inverse proportion to pressure. Under an ideal-gas approximation, the pressure dependence of the ρfD term may therefore be moderate. Thus, under the present model assumptions, the reduction in evaporation rate may be mainly associated with the decreases in BM,i and ln(1+BM,i) caused by the reduction in Xi,v,s. Overall, the total evaporation rate of UWS is predicted to decrease with increasing ambient pressure.
Maximum surface partial pressures and the corresponding surface vapor mole fractions of water and urea for an evaporating UWS droplet at an ambient temperature of 673 K under different ambient absolute pressures
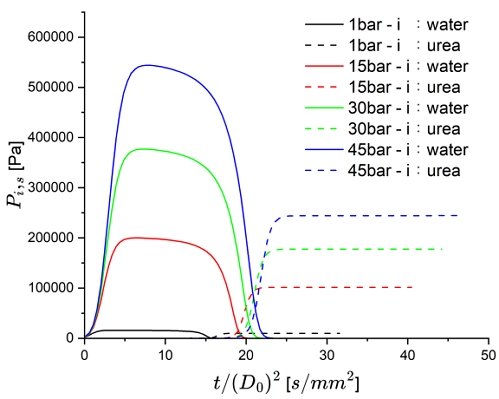
Droplet surface vapor pressure of an evaporating UWS droplet at 673 K under different ambient absolute pressures
Figure 7 compares the dependence of NH3 conversion efficiency on residence time under different ambient absolute pressures. Under all pressure conditions, NH3 conversion efficiency increases with residence time, although the rate of increase gradually decreases as residence time becomes longer. In addition, NH3 conversion efficiency shows a slight overall decrease with increasing pressure, and the reduction is relatively more pronounced as the pressure increases from 1 bar to 15 bar. By contrast, the additional decrease from 15 bar to higher pressures is limited, indicating that the pressure effect tends to weaken at higher pressures. The decrease in NH3 conversion efficiency from 1 bar to 45 bar was only 1.06 percentage points, which is smaller than the RMSE values of 3.16–5.02 percentage points obtained from the atmospheric pressure spray validation. Therefore, the pressure-induced decrease should not be interpreted as a significant quantitative difference. Instead, the result indicates that pressure has a weaker influence on NH3 conversion efficiency than inlet temperature and residence time under the present assumptions.
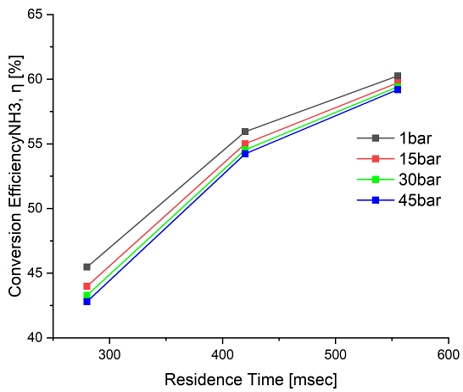
Calculated NH3 conversion efficiency at different inlet absolute pressures (Tin = 673 K, Vin = 10.8 m/s)
Figure 8 shows the gas phase temperature distribution in the duct at Tin = 673 K. As shown by the water vapor mass fraction contours in Figure 9, water evaporation predominates in the spray core region immediately downstream of the injector and the evaporative cooling caused by latent heat consumption leads to a local temperature drop near the injector. As the droplets move downstream, the spray disperses and water evaporation weakens. Consequently, the cooling effect decreases, and the temperature field gradually recovers toward the inlet temperature through mixing with the hot gas stream and convective heating. As a result, a more uniform temperature distribution appears farther downstream. In addition, gas phase urea thermolysis and HNCO hydrolysis can also influence the local temperature field.

Instantaneous temperature contour in the duct (Tin = 673 K, Pin = 30 bar, absolute)

Instantaneous water vapor mass-fraction contour in the duct (Tin = 673 K, Pin = 30 bar, absolute)
The NH3 mass fraction contours in Figure 10 show that NH3 does not increase markedly immediately after injection, but instead increases farther downstream and spreads over a wider region. This behavior is consistent with the UWS reaction pathway, in which water evaporation occurs first, followed by urea vaporization and thermolysis, and then by HNCO hydrolysis. These spatial distributions provide additional insight into the pressure effect results. The temperature and water vapor fields indicate that evaporation is concentrated near the spray core and that latent heat consumption produces a local cooling region downstream of the injector. This local cooling may delay urea vaporization and subsequent gas phase reactions. The NH3 field further shows that ammonia formation is not controlled only by evaporation near the injector, but also by down-stream vapor transport and the available residence time for urea thermolysis and HNCO hydrolysis. Therefore, under the present model assumptions, the weak pressure dependence of the outlet NH3 conversion efficiency may be interpreted as a possible combined effect of pressure suppressed evaporation, downstream mixing, and finite reaction residence time.

Instantaneous NH3 mass-fraction contour in the duct (Tin = 673 K, Pin = 30 bar, absolute)
5. Conclusions
This study analyzed single droplet evaporation, in-duct spray NH3 conversion, and the behavior of UWS evaporation and NH3 conversion under high-pressure conditions using a numerical model for UWS evaporation and decomposition. The main conclusions are as follows.
(1) Under atmospheric pressure conditions, the RM model reproduced the UWS evaporation behavior observed in the single droplet experiments of Wang et al. with reasonable agreement. This result indicates that the RM model can be used to predict the evaporation behavior of a single UWS droplet under high-temperature conditions.
(2) Based on the validated RM model, the in-duct UWS spray and NH3 conversion efficiency reported by Kim et al. were reproduced numerically. The results showed that the numerical model was able to capture the overall trends of NH3 conversion efficiency with residence time and inlet temperature reasonably well.
(3) By introducing high-pressure corrections into the RM model validated under atmospheric pressure conditions, the evaporation and NH3 conversion efficiency of UWS under high-pressure were numerically predicted. The results showed that, as the pressure increased from 1 bar to 15, 30, and 45 bar, the NH3 conversion efficiency decreased slightly from 60.26% to 59.72%, 59.41%, and 59.20%, respectively. Overall, increasing pressure was predicted to cause only a slight decrease in NH3 conversion efficiency. Because direct high-pressure validation was not available, this result should be regarded as a predicted trend rather than a fully validated quantitative result.
Overall, the present study shows that, based on the RM model validated under atmospheric pressure conditions, the introduction of high-pressure corrections enables the numerical investigation of UWS evaporation and NH3 conversion behavior under high-temperature and high-pressure conditions. Further validation through high-pressure experiments is still needed. In future work, UWS will be injected into a sealed high-pressure stirred vessel to examine NH3 formation under confined high-pressure conditions. The experiments will be designed to verify the pressure-dependent trends predicted in this study, particularly the pressure-suppressed evaporation behavior and the resulting changes in NH3 conversion efficiency. The effects of gas temperature, residence time, wall interaction, crystallization, and possible deposit formation should also be considered because these factors were simplified or not explicitly included in the present numerical model. Such experimental data will be useful for evaluating the applicability and limitations of the present model under high-pressure conditions.
Nomenclature
| A : | Peng–Robinson equation parameter |
| B : | Peng–Robinson equation parameter |
| BM : | Spalding mass transfer number |
| BT : | Spalding heat transfer number |
| c : | Molar concentration [mol/m3] |
| Cp : | Specific heat [J/kg·K] |
| D : | Binary diffusivity [m2/s] |
| d : | Droplet diameter [m] |
| G : | The NRTL exponential term |
| : | Vaporization rate [kg/s] |
| : | Molar flow rate [mol/s] |
| N : | The number of experimental data points |
| P : | Pressure [Pa] |
| Pc : | Critical pressure [Pa] |
| : | Rate of heat transfer [J/s] |
| R : | Universal gas constant [J/(kmol·K)] |
| r : | Reaction rate [mol/(m³·s)] |
| Sh : | Sherwood number |
| T : | Temperature [K] |
| Tc : | Critical temperature [K] |
| V : | Volume [m³] |
| X : | Mole fraction |
| Y : | Mass fraction |
| Z : | Compressibility factor |
| abs : | Absolute |
| f : | Vapor film |
| hy : | Hydrolysis |
| i : | Component |
| ∞ : | Ambient conditions |
| L : | Latent heat [ J/kg, J/mol] |
| Mix : | Mixture |
| s : | Droplet surface |
| sat : | Saturation conditions |
| th : | Thermolysis |
| u : | Urea |
| v : | Vapor phase |
| w : | Water |
| ρ : | Density [kg/m3] |
| Π : | Poynting factor |
| γ : | Activity coefficient |
| ϕ : | Fugacity coefficient |
| φ : | Quantity used for RMSE calculation |
| η : | Ammonia conversion efficiency |
| τ : | The NRTL interaction parameter |
| 0 : | Initial condition |
| * : | Modified value |
Acknowledgments
This research was supported by Korea Institute of Marine Science & Technology Promotion (KIMST) funded by the Ministry of Oceans and Fisheries (RS-2022-KS221683, Improvement of legal system and development of IMO standard agenda for commercialization of ecofriendly ships).
Author Contributions
Conceptualization, C. C. Li and S. H. Jung; Methodology, C. C. Li; Software, C. C. Li; Validation, C. C. Li; Formal Analysis, C. C. Li; Investigation, C. C. Li; Resources, C. C. Li; Data Curation, C. C. Li; Writing—Original Draft Preparation, C. C. Li; Writing—Review & Editing, J. Cheon; Visualization, C. C. Li; Supervision, J. Cheon; Project Administration, S. H. Jung; Funding Acquisition, S. H. Jung.
References
-
M. F. Hsieh and J. Wang, “Development and experimental studies of a control-oriented SCR model for a two-catalyst urea-SCR system,” Control Engineering Practice, vol. 19, no. 4, pp. 409-422, 2011.
[https://doi.org/10.1016/j.conengprac.2011.01.004]

-
P. Forzatti, P. “Present status and persp -ectives in de-NOx SCR catalysis,” Applied catalysis A: general, vol. 222, no. 1-2, pp. 221-236, 2001.
[https://doi.org/10.1016/S0926-860X(01)00832-8]
-
C. M. Schar, C. H. Onder, and H. P. Geering, “Control of an SCR catalytic converter system for a mobile heavy-duty application,” IEEE Transactions on Control Systems Technology, vol. 14, no. 4, pp. 641-653, 2006.
[https://doi.org/10.1109/TCST.2006.876634]
-
T. J. Wang, S. W. Baek, S. Y. Lee, D. H. Kang, and G. K. Yeo, “Experimental investigation on evaporation of urea‐water‐solution droplet for SCR applications,” AIChE Journal, vol. 55, no. 12, pp. 3267-3276, 2009.
[https://doi.org/10.1002/aic.11939]
-
L. Wei, Z. Youtong, and M. Asif, “Investigation on UWS evaporation for vehicle SCR applications,” AIChE Journal, vol. 62, no. 3, pp. 880-890, 2016.
[https://doi.org/10.1002/aic.15078]
- S. Kontin, A. Höfler, R. Koch, and H. J. Bauer, “Heat and Mass Transfer accompanied by Crystallisation of single Particles containing Urea-water-solution,” In 23rd Annual Conference on Liquid Atomization and Spray Systems, 2010.
-
P. M. Schaber, J. Colson, S. Higgins, D. Thielen, B. Anspach, and J. Brauer, “Thermal decomposition (pyrolysis) of urea in an open reaction vessel,” Thermochimica acta, vol. 424, no. 1-2, pp. 131-142, 2004.
[https://doi.org/10.1016/j.tca.2004.05.018]
- J. Y. Kim, S. H. Ryu, and J. S. Ha, “Numerical prediction on the characteristics of spray-induced mixing and thermal decomposition of urea solution in SCR system,” In Internal Combustion Engine Division Fall Technical Conference, vol. 37467, pp. 165-170, 2008.
-
V. Shirodkar, “Urea-water droplet phase change and reaction modelling: Multi-component evaporation approach. Frontiers in Heat and Mass Transfer (FHMT),” vol. 7, no. 1, pp. 1-8, 2016.
[https://doi.org/10.5098/hmt.7.5]
-
E. Abu‐Ramadan, K. Saha, and X. Li, “Modeling the depleting mechanism of urea‐water‐solution droplet for automotive selective catalytic reduction systems,” AIChE Journal, vol. 57, no. 11, pp. 3210-3225, 2011.
[https://doi.org/10.1002/aic.12523]
-
D. T. Ryddner and M. F. Trujillo, “Modeling urea-water solution droplet evaporation,” Emission Control Science and Technology, vol. 1, no. 1, pp. 80-97, 2015.
[https://doi.org/10.1007/s40825-014-0006-3]
-
E. Abu-Ramadan, K. Saha, and X. Li, “Modeling of the injection and decomposition processes of urea –water -solution spray in automotive SCR systems (No. 2011-01-1317), SAE Technical Paper, 2011.
[https://doi.org/10.4271/2011-01-1317]
-
S. Mikhil, S. Bakshi, T. N. C. Anand, “A computational model for the evaporation of urea-water-solution droplets exposed to a hot air stream,” International Journal of Heat and Mass Transfer, vol. 168, 120878, 2021.
[https://doi.org/10.1016/j.ijheatmasstransfer.2020.120878]
-
E. N. Fuller, P. D. Schettler, and J. C. Giddings, “New method for prediction of binary gas-phase diffusion coefficients,” Industrial & Engineering Chemistry, vol. 58, no. 5, pp. 18-27, 1966.
[https://doi.org/10.1021/ie50677a007]
-
D. R. Beti, P. Panja, C. Jiang, M. Milovic, R. Robinson, T. A. Ring, and R. Levey, “Change in hydrocarbon composition in rock samples as a function of time: A thermodynamic evaporation model,” Journal of Natural Gas Science and Engineering, vol. 77, p. 103238, 2020.
[https://doi.org/10.1016/j.jngse.2020.103238]
-
A. R. Goodwin, J. Sengers, and C. J. Peters, (Eds.) Applied Thermodynamics of Fluids: Royal Society of Chemistry, 2010.
[https://doi.org/10.1039/9781849730983]
-
D. Y. Peng and D. B. Robinson, “A new two-constant equation of state,” Industrial & Engineering Chemistry Fundamentals, vol. 15, no. 1, pp. 59-64, 1976.
[https://doi.org/10.1021/i160057a011]
-
B. Abramzon and W. A. Sirignano, “Droplet vaporization model for spray combustion calculations,” International Journal of Heat and Mass Transfer, vol. 32, no. 9, pp. 1605-1618, 1989.
[https://doi.org/10.1016/0017-9310(89)90043-4]
-
A. Lundström, B. Waldheim, H. Ström, and B. Westerberg, “Modelling of urea gas phase thermolysis and theoretical details on urea evaporation,” Proceedings of the Institution of Mechanical Engineers, Part D: Journal of Automobile Engineering, vol. 225, no. 10, pp. 1392-1398, 2011.
[https://doi.org/10.1177/0954407011406048]
-
V. N. Emel'yanenko, G. J. Kabo, and S. P. Verevkin, “Measurement and prediction of thermochemical properties: Improved increments for the estimation of enthalpies of sublimation and standard enthalpies of formation of alkyl derivatives of urea,” Journal of Chemical & Engineering Data, vol. 51, no. 1, pp. 79-87, 2006.
[https://doi.org/10.1021/je050230z]
-
A. M. Bernhard, I. Czekaj, M. Elsener, A. Wokaun, and O. Kröcher, “Evaporation of urea at atmospheric pressure,” The Journal of Physical Chemistry A, vol. 115, no. 12, pp. 2581-2589, 2011.
[https://doi.org/10.1021/jp112066m]
-
H. Dong, S. Shuai, and J. Wang, “Effect of urea thermal decomposition on diesel NOx-SCR aftertreatment systems (No. 2008- 01-1544),” SAE Technical Paper, 2008.
[https://doi.org/10.4271/2008-01-1544]
-
F. Birkhold, U. Meingast, P. Wassermann, and O. Deutschmann, “Modeling and simulation of the injection of urea - water - solution for automotive SCR DeNOx – systems,” Applied Catalysis B: Environmental, vol. 70, no. 1-4, pp. 119-127, 2007.
[https://doi.org/10.1016/j.apcatb.2005.12.035]
-
F. Birkhold, U. Meingast, P. Wassermann, and O. Deutschmann, “Analysis of the injection of urea-water - solution for automotive SCR DeNOx - systems: Modeling of two - phase flow and spray/wall – interaction,” SAE Transactions, pp. 252-262, 2006.
[https://doi.org/10.4271/2006-01-0643]
-
M. Koebel, M. Elsener, and M. Kleemann, “Urea-SCR: a promising technique to reduce NOx emissions from automotive diesel engines,” Catalysis today, vol. 59, no. 3-4, pp. 335-345, 2000.
[https://doi.org/10.1016/S0920-5861(00)00299-6]