Optimal transmitter placement using the ray-tracing technique considering received power and load balancing
Copyright © The Korean Society of Marine Engineering
This is an Open Access article distributed under the terms of the Creative Commons Attribution Non-Commercial License (http://creativecommons.org/licenses/by-nc/3.0), which permits unrestricted non-commercial use, distribution, and reproduction in any medium, provided the original work is properly cited.
Abstract
In this paper, we propose an optimization technique for transmitter placement that can deliver stable received power in an area of interest and properly distribute the traffic of each transmitter. For optimal transmitter placement, the received power delivered to receiver points must be predicted. Because the indoor radio environment, such as the received power distribution, fluctuates through indoor structures and their materials, for a more specific analysis, we use the deterministic ray tube method, one of the ray-tracing techniques. A genetic algorithm is applied to achieve traffic load-balancing and received power distribution. Therefore, the proposed method can be used in complex indoor environments, resulting in optimal positions and a minimum number of transmitters. In addition, the proposed optimization technique verifies to offer the required traffic for each user and to distribute high received power in any interested region.
Keywords:
Access points, Genetic algorithm, Load balancing, Ray-tracing, Receiver power1. Introduction
Recent advancements in wireless communication technologies such as Wi-Fi and B5G/6G have led to an increase in indoor services. These systems offer mobility, convenience, and flexibility in installation that were previously lacking in wired technologies. Consequently, new application fields have continuously emerged, providing users with diverse and innovative functionalities. When deploying wireless networks in real environments, satisfying the required received power throughout the service area is crucial, ensuring reliable data traffic reception regardless of the location of receiving nodes. Determining the optimal number and placement of receiving nodes to distribute traffic evenly across an entire target area remains a key challenge.
To achieve the optimal placement, the propagation characteristics of the entire area must be understood. Empirical and semi-empirical propagation models have been used to analyze indoor wireless environments [1]-[3]. Although these models offer the advantage of rapid estimation of radio propagation characteristics, they fail to accurately estimate propagation environments in complex indoor structures, particularly at higher frequencies. Consequently, determining the optimal placement of access points becomes challenging.
Moreover, although the received signal strength and path loss are critical factors influencing the reception quality and connectivity of scattered nodes in the entire space, evenly distributing the traffic required by each node is equally important in determining the optimal placement of access points [4],[5]. As the operating frequency bands increase and accurate radio environment modeling becomes easier, the use of ray tracing in indoor environments is increasing [6]. However, appropriately distributing the traffic such that each node can provide the desired amount of traffic is also an important factor in finding the optimal location of the receiving node [7].
The design of existing wireless network systems relies on experimental information and the designer’s experience in real environments. Hence, it requires a lot of time and manpower and is inefficient [8]. Therefore, a method using optimization techniques to determine the optimal location of receiving nodes has been proposed [1],[9]. The problem of optimizing the location of receiving nodes in indoor spaces is a combinatorial optimization problem where setting an objective function is difficult because it is determined by numerous factors such as the layout of the space, internal structure, and radio environment. To solve this problem, a metaheuristic method that develops a discovery method has been devised [10]-[13].
Various techniques can be used for optimization, including global optimization techniques such as particle swarm optimization and simulated annealing. The authors of [5] have demonstrated that a genetic algorithm (GA) performs competitively in wireless network optimization problems. The optimization problem in our study involves a highly nonlinear and multi-objective search space with constraints related to the received power and traffic load distribution. A GA is particularly suitable for such combinatorial problems because it does not require gradient information and can efficiently explore a large solution space, thereby reducing the risk of being trapped in a local minimum. Therefore, optimization in our study uses a GA.
This paper proposes an optimal placement method that employs a deterministic ray tube method, overcoming the limitations of empirical propagation models. Additionally, a GA is used to optimize the placement, ensuring balanced traffic distribution among users.
The main contributions of this study are as follows:
- • A novel transmitter placement optimization framework that integrates the deterministic ray tube method with a GA, allowing for both accurate received power prediction and balanced traffic distribution.
- • An improved approach to addressing the limitations of empirical propagation models, ensuring better adaptability to complex indoor environments.
- • A comprehensive performance evaluation, demonstrating that the proposed method significantly enhances coverage and traffic load balancing compared with conventional placement techniques.
The remainder of this paper is organized as follows: Section 2 describes the indoor propagation prediction model. Section 3 details the optimization process using a GA. Section 4 presents case studies and analysis results for a specific building structure. Finally, Section 5 concludes our work.
2. Indoor Propagation Prediction Model
Unlike outdoor radio environments, indoor radio environments are less affected by weather conditions such as snow, rain, clouds, and temperature variations. However, they are significantly influenced by internal structures and materials, including the size and layout of buildings, walls, pillars, and windows. Additionally, reflections and diffractions caused by obstacles within buildings lead to complex multipath interference, making indoor propagation environments more complicated than outdoor environments. Accurate indoor propagation prediction is crucial for the optimal placement of transmitters (Txs) to ensure reliable communication.
To address this challenge, this study utilizes the deterministic ray tube method to analyze indoor propagation environments, overcoming the limitations of conventional ray-tracing models. The ray tube method [8] is fundamentally a point-to-point ray-tracing technique based on image theory. When a transmission point is provided, the virtual sources generated by the building walls and edges within the analysis area are categorized into three types: transmission, reflection, and diffraction tubes, as shown in Figure 1. Transmission tubes are generated by transmitting antennas, reflection tubes are created by radio wave reflections off building walls, and diffraction tubes represent diffracted waves caused by building edges.
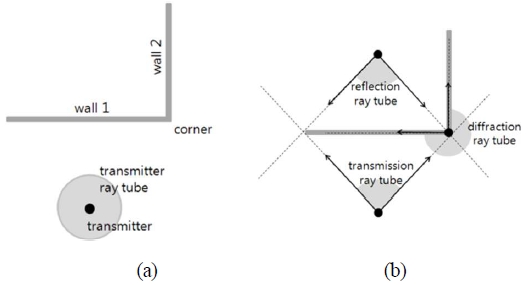
Generation and definition of a ray tube: (a) transmitter ray tube, (b) reflection and diffraction ray tubes
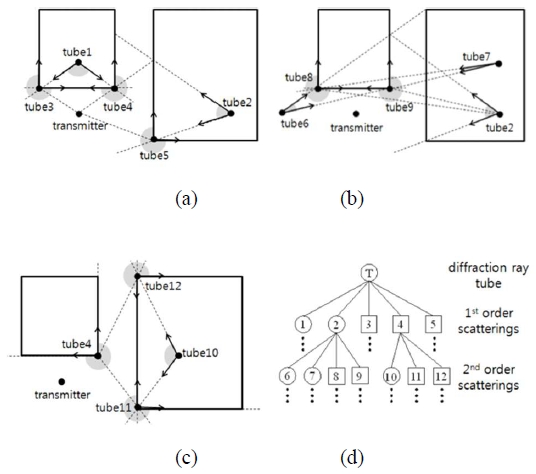
The deterministic ray tube method continuously generates these ray tubes until they reach the specified number of reflections and diffractions, as illustrated in Figure 2(a)-(c). These are then stored in a tree structure, as shown in Figure 2(d). By tracing the propagation path from the reception point back to the transmission point within the ray tube tree, the method efficiently and accurately interprets the indoor propagation environment.
3. Optimization Process
This section explains the process of finding the optimal placement of Txs. To achieve this, a fitness function is first defined to quantify the system performance required by optimal Tx candidates. Then, a GA—a type of metaheuristic method designed to solve complex combinatorial optimization problems—is applied to determine the optimal number and locations of Txs.
3.1 Fitness Function Definition
The fitness function quantitatively represents the system performance that optimal Tx candidates must achieve. To realize the optimal Tx placement, the fitness function value should be maximized. The variables for the fitness function are the positions of the Txs, and the system performance metrics include the service area, path loss, quality of service, channel capacity, and interference between adjacent Txs. Most existing methods for Tx placement have focused on minimizing path loss within the service area or maintaining the average path loss below a certain level [1],[5].
However, optimizing Tx placement based solely on path loss can lead to an imbalanced traffic distribution. In such cases, excessive traffic demand may occur at one Tx. Although users connected to Tx1 may receive high-quality signals, the sheer number of users connected to Tx1 may result in unmet traffic requirements.
Therefore, we propose a fitness function that emphasizes load balancing across the entire service area, efficiently distributing both received power and user traffic, as expressed in
| (1) |
where f1 and f2 are fitness functions for load balancing and received power, respectively, and fi' represents the standardized normalization of fitness function fi. Weights wi are applied to each fitness function to adjust the relative importance of system performance metrics according to different scenarios. Therefore, in this study, when considering both reception power and load balancing, the weights are set to 0.5, and when considering only reception power, w1 and w2 are set to 0 and 1.0, respectively.
The proposed fitness function is a multi-objective function that considers both received power and load balancing. Because these two fitness functions are not directly comparable in the same unit, they are normalized using standard distribution methods [15] to allow for a balanced comparison. Additionally, weights are assigned to each fitness function to adjust the importance of system performance metrics based on specific requirements.
The load-balancing fitness function is defined as follows:
| (2) |
where Li represents the amount of traffic required by the users connected to the i-th Tx. Function f1 is defined as the standard deviation of the traffic load at each Tx, effectively serving as a fitness function for load balancing. Therefore, load balancing is performed using the standard deviation of the traffic load covered by each Tx.
The fitness function for received power is defined by
| (3) |
where N is the total number of receiving points analyzed using the deterministic ray tube method, and M and L are the total number of Txs and the number of receiving points with power less than τ, respectively. Parameter τ is a threshold for poor received power, α is a weight for the first and second terms on the right-hand side, ωi represents the weight at each receiving point, and Pij is the received power at the i-th receiving point from the j-th Tx.
The first term on the right-hand side of (3) represents the weighted average of the received power across all receiving points, indicating better-received power distribution throughout the service area. The second term on the right-hand side of (3) represents the average of receiving points with power below threshold τ, implying an improvement in low-received power areas.
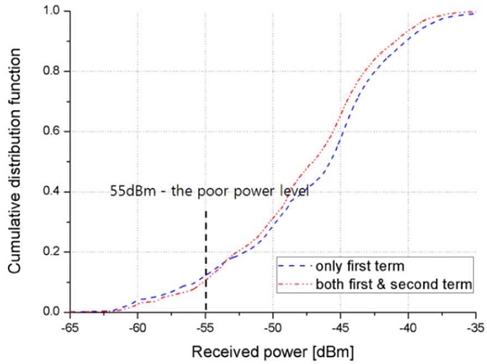
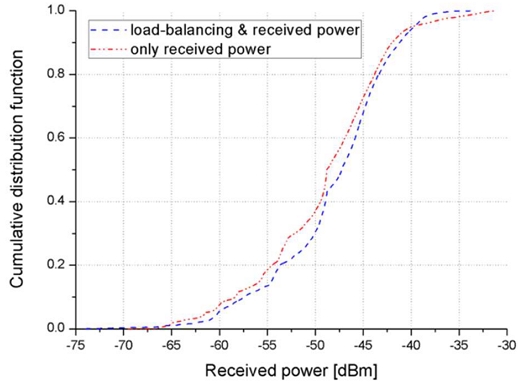
Therefore, through these two fitness functions, we can achieve an overall excellent received power while also ensuring that the level of load allocated to each Tx is similar. Figure 3 illustrates the cumulative distribution function (CDF) of received power for cases where only the first term or both terms are considered in the optimization process.
By setting threshold τ to -55 dBm, the distribution of received power above -55 dBm is higher than when only the first term is considered, whereas the distribution below -55 dBm is lower. This result reflects the general behavior in wireless communication, where the bit error rate (BER) remains low up to a certain signal-to-noise ratio (SNR) but rapidly increases below this level. Therefore, selecting an appropriate threshold t enables the placement of Txs that provide reliable signal reception throughout the service area.
3.2 Application of a Genetic Algorithm (GA)
The concept of a GA is based on the principles of genetics and biological evolution. In nature, weaker or defective individuals are eliminated through natural selection, allowing only the fittest individuals to pass on their genetic traits to the next generation. Over long periods of time, only individuals with superior genetic characteristics survive. Occasionally, random mutations occur during the evolutionary process, and if these mutations provide a survival advantage, they lead to the evolution of a new species. A GA leverages this natural evolutionary law wherein individuals with advantageous traits adapt better to their environment and produce superior offspring [16].
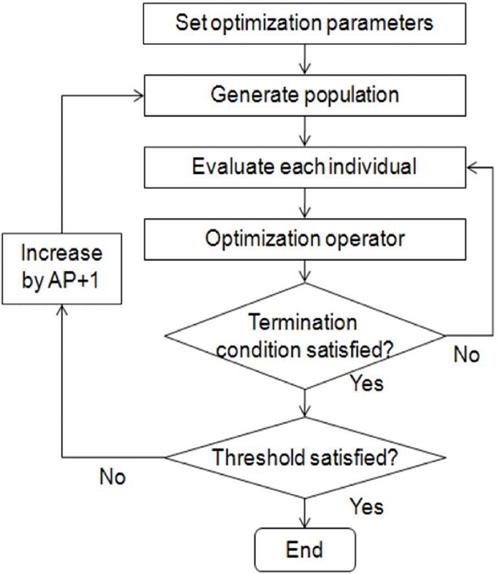
In this work, a GA is applied to optimize Tx placement, as illustrated in the flowchart in Figure 4. Several parameters must be set for the optimization process, including population size (determining the convergence speed), crossover probability, and mutation probability. Additionally, the number of Txs to be deployed within the service area is configured. In the GA, the population is defined as Txs, and the chromosome is represented by the positions of Txs.
Figure 5 illustrates the representation of a population of size N in the GA. Each chromosome encodes the positions of the candidate Txs within the service area using binary digits that are then arranged sequentially. Similarly, the x and y coordinates of each Tx are also represented in binary form, following the same encoding method as the Tx itself.
The process of finding the optimal Tx placement is as follows: Initially, a population of candidate Tx sets is randomly generated according to the specified population size. These candidates are then evaluated using the fitness function defined in Section 3.1. Based on the evaluated fitness scores, three main genetic operations are performed: selection, crossover, and mutation.
Figure 6 illustrates these operations that are iteratively applied to evolve the population toward the optimal Tx placement.
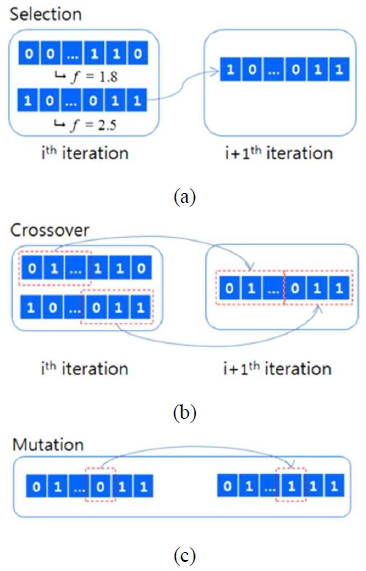
Operation of the genetic algorithm (a) Selection operation (b) Crossover operation (c) Mutation operation
- • Selection: In this step, individuals with higher fitness scores are more likely to be replicated. This study employs the tournament selection method where three individuals are randomly chosen from the population and the individual with the highest fitness is selected.
- • Crossover: This operation involves exchanging parts of the selected chromosomes to create new offspring for the next generation. By recombining genetic information, crossover increases the possibility of producing individuals with higher fitness.
- • Mutation: The mutation operation introduces new genetic material that is difficult to obtain through selection and crossover alone. This enhances the diversity of the population, preventing premature convergence to local optima.
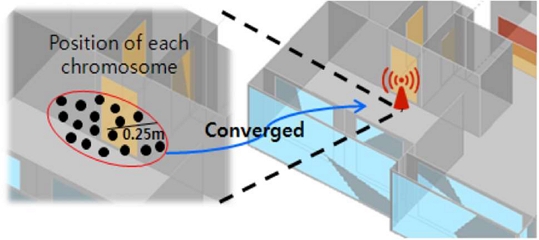
In the same way that only individuals with superior genetic traits survive over time in nature, the repeated execution of the operations illustrated in Figure 6 causes each individual to eventually converge to the fittest solutions, that is, the optimized Tx positions. The stopping criterion for the algorithm is defined as shown in Figure 7: when the candidate Tx positions of each individual converge within a distance of 0.25 m, the iterations are terminated, considering the solution sufficiently optimized.
However, this does not fully conclude the Tx placement process. After determining the optimal Tx positions, they are set as transmitters, and the received power throughout the service area is analyzed. If any receiving point experiences insufficient received power, an additional Tx is introduced into the service area, and the optimization process is repeated. Through this iterative process, the algorithm ultimately determines the optimal Tx positions and the minimum number of Txs required to efficiently cover the entire service area.
4. Simulation Results and Analysis
4.1 Simulation Process
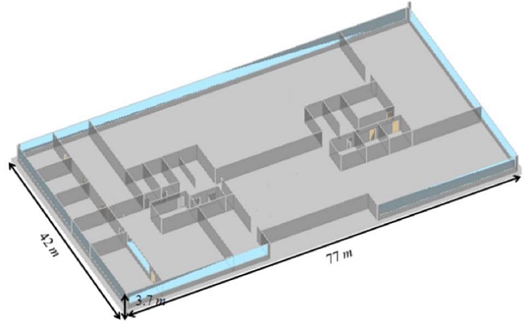
The proposed Tx optimal placement method was simulated using an indoor building structure measuring 77 m in width, 42 m in length, and 3.7 m in height, as shown in Figure 8. In this simulation, interference from other Txs was not considered. This assumption is based on the fact that, in a WLAN environment, three independent channels (Channels 1, 6, and 11) or four independent channels (Channels 1, 5, 9, and 13) exist. Even if Txs using these channels are adjacent, they can operate without interfering with each other [17]. Additionally, even if more than four Txs are required to cover the entire indoor space, they can be placed at sufficient distances to prevent mutual interference.
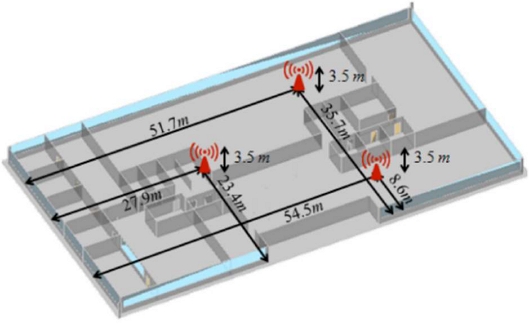
Details of the simulation are as follows: In indoor environments, access points (APs) are typically installed on the ceiling. Therefore, the candidate APs generated during the optimization process were positioned 3.5 m above the floor, which is 20 cm below the ceiling. The receiving points in the service area were positioned 1 m above the floor, spaced approximately 2.5 m apart, totaling 527 receiving points. The traffic demand was assumed to be uniformly distributed across the entire service area without any regional bias. The frequency was set to 2.4 GHz, suitable for an IEEE 802.11 b/g/n WLAN environment. Both APs and user devices were assumed to use dipole antennas with omnidirectional radiation patterns.
The AP model used in the simulation was based on the Cisco Aironet 1230AG series, transmitting at 17 dBm. The threshold for received power, set as the termination condition for the algorithm, was defined as -86 dBm, corresponding to the 6 Mbps transmission rate of IEEE 802.11g. Additionally, the poor received power threshold (τ) was set to -70 dBm, corresponding to the maximum transmission rate of 54 Mbps in IEEE 802.11g. The population size was set to 80, with an initial AP count of 2. Crossover and mutation probabilities were set to 0.75 and 0.05, respectively.
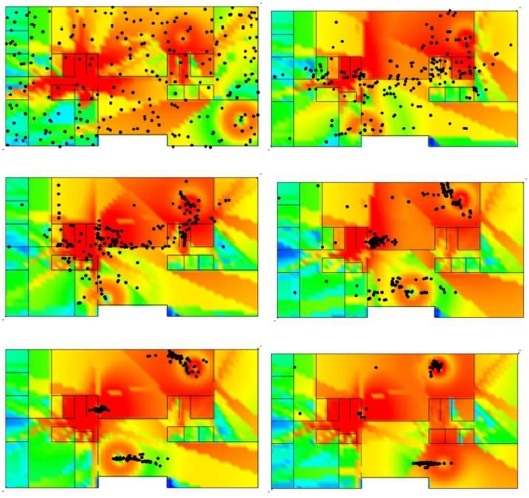
The simulation started with two APs; however, after optimization, certain receiving points had received power below -86 dBm. Therefore, an additional AP was introduced, and the optimization process was repeated. Figure 9 shows the convergence process of the candidate APs when three APs were used. Initially, the candidate APs were randomly distributed; however, as the iterative process progressed, they converged to three optimal locations. After 100 iterations, the final optimal AP placement was achieved, as shown in Figure 10.
4.2 Simulation Results and Discussion
To analyze the optimal AP placement that considers both load balancing and received power, the results were compared with the optimal placement results considering only the received power, as shown in Figure 11. When both load balancing and received power were considered, the optimal AP positions were (27.9, 23.4), (51.7, 35.7), and (54.5, 8.6). When only the received power was considered, the optimal AP positions were (18.9, 13.9), (20.9, 30.5), and (54.0, 12.7). Although the internal structure was identical in both cases, the resulting AP placements were significantly different.
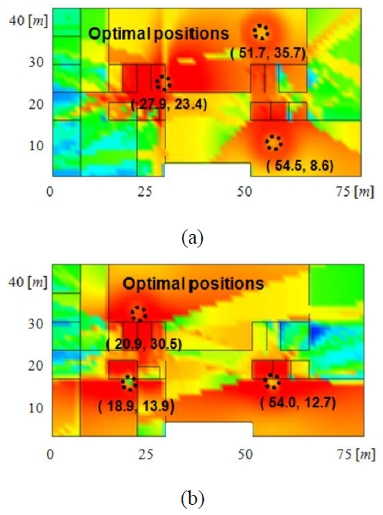
Comparison of the optimal AP placement result for the fitness function (a) Case of the proposed fitness function (b) Case considering only received power
The CDFs were plotted, as shown in Figure 12, to compare the distribution of the received power in both cases. The difference between the two graphs was not statistically significant. However, when both load balancing and received power were considered, more receiving points had lower received power, leading to a slightly worse performance in terms of the received power distribution.
To further analyze the results, Figure 13 and Table 1 present the service regions connected to each AP, along with the area and portion occupied by each region. If a receiving point can connect to more than one AP, it is assumed to connect to the AP with the highest received power. As shown in Figure 13(a), when both load balancing and received power were considered, all APs had similar service regions. By contrast, as shown in Figure 13(b), where only the received power was considered, AP1 covered nearly half of the total service area, whereas AP2 covered only 16.3%. This imbalance resulted in concentrated traffic at AP1, leading to an inefficient AP placement. Meanwhile, when only load balancing was considered, the service region was divided into exactly three areas, as summarized in Table 1.

Comparison of the service region connected to each AP (a) Case of the proposed fitness function (b) Case considering only received power
To verify the effectiveness of the proposed optimal AP placement method in a realistic environment, additional simulations were conducted. As shown in Figure 14, 50 users were randomly distributed to simulate real-world scenarios, and their traffic demands were varied using Network Simulator 2 (NS-2). The throughput provided by each AP was then evaluated based on these traffic variations.
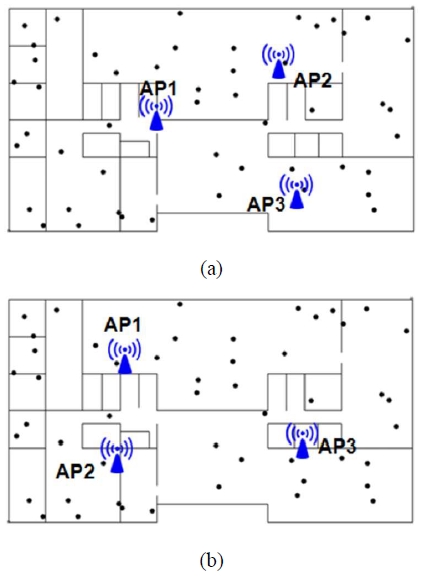
Placement of AP and users for NS-2 simulation (a) Case of the proposed fitness function (b) Case considering only received power
The simulation environment in NS-2 was configured as follows: An IEEE 802.11g infrastructure network with 50 nodes and APs was set up, as illustrated in Figure 14. All nodes generated identical traffic by periodically sending 1000-byte TCP packets. The noise level was set to -96 dBm to account for BER variations owing to changes in the received power within the wireless channel. Additionally, the transmission and received powers in the simulation were calculated using the deterministic ray tube method.
The simulation varied the transmission intervals of the TCP packets for each node, thereby changing the traffic demand for each user. The resulting changes in the total throughput delivered by the APs were observed. Figure 15 presents the throughput results when the traffic demand varied from 50 to 1200 kbps per node.
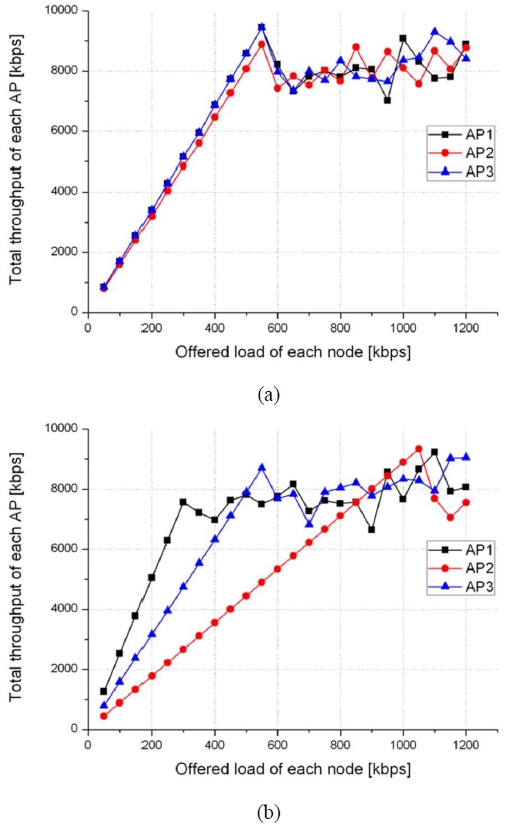
Throughput offered by each AP for the traffic changes of each node (a) Case of the proposed fitness function (b) Case considering only received power
The results, as shown in Figure 15(a), demonstrated that the proposed AP placement method provided efficient coverage throughout the indoor space, regardless of the location, even under varying traffic demands. This was because each AP served a similar-sized service area, leading to a balanced user distribution across all APs. By contrast, as shown in Figure 15(b), AP1 covered the largest service area whereas AP2 covered the smallest. AP1 could reliably serve user demands up to 300 kbps but failed to meet demands beyond that limit owing to capacity constraints. Meanwhile, AP2 could support up to 1050 kbps owing to a smaller number of connected users. However, the overall AP placement was inefficient because AP1 was responsible for nearly half of the total service area.
These findings demonstrated that considering both the received power and traffic demands was essential for determining the optimal number and placement of APs, ensuring a balanced load distribution and improved overall network performance.
5. Conclusion
In this study, an optimal Tx placement method was proposed to effectively distribute user traffic demands while ensuring reliable received power in indoor wireless environments. To achieve an accurate indoor propagation analysis, the deterministic ray tube method was employed, and a GA, commonly used for solving combinatorial optimization problems, was applied to find the optimal Tx placement.
The proposed method was applied to a realistic building structure, and the minimum number of APs and their optimal locations were determined. The performance of the proposed method was verified by analyzing the received power distribution and throughput provided by the APs. The results demonstrated that the proposed method effectively balanced user traffic while maintaining reliable coverage throughout the service area. This approach proves to be highly applicable to the rapidly growing field of indoor wireless communication, particularly in setting up wireless network systems for office buildings and other complex indoor environments.
Acknowledgments
This research is the results of a study on the "Leaders in INdustry-university Cooperation 3.0" Project, supported by the Ministry of Education and National Research Foundation of Korea.
Author Contributions
Conceptualization, S. Yang and D.-W. Seo; Methodology, J.-H. Han; Software, J.-H. Han; Validation, S. Yang and D.-W. Seo; Formal Analysis, J.-H. Han; Investigation, G.-D. Kim; Resources, S. Yang; Data Curation, S. Yang; Writing—Original Draft Preparation, J.-H. Han; Writing—Review & Editing, D.-W. Seo; Visualization, J.-H. Han; Supervision, G.-D. Kim; Project Administration, D.-W. Seo; Funding Acquisition, G.-D. Kim.
References
-
Z. Ji, T. K. Sarkar, and B.-H. Li, “Methods for optimizing the location of base stations for indoor wireless communications,” IEEE Transactions on Antennas and Propagation, vol. 50, no. 10, pp. 1481-1483, 2002.
[https://doi.org/10.1109/TAP.2002.802155]

-
S. Kouhbor, J. Ugon, A. Rubinov, A. Kruger, and M. Mammadov, “Coverage in WLAN with minimum number of access points,” in Proceedings of IEEE VTC’06 Spring, vol. 3, pp. 1166-1170, Melbourne, Australia, May. 2006.
[https://doi.org/10.1109/VETECS.2006.1683018]

-
S. Deng, M. K. Samimi, and T. S. Rappaport, “28 GHz and 73 GHz millimeter-wave indoor propagation measurements and path loss models,” 2015 IEEE International Conference on Communication Workshop (ICCW), pp. 1244-1250, London, UK, 2015.
[https://doi.org/10.1109/ICCW.2015.7247348]

-
S. Grubisic, W. P. Carpes, and J. P. A. Bastos, “Optimization model for antenna positioning in indoor environments using 2-D ray-tracing technique associated to a real-coded genetic algorithm,” IEEE Transactions on Magnetics, vol. 45, no. 3, Mar. 2009.
[https://doi.org/10.1109/TMAG.2009.2012760]

-
Z. Yun, S. Lim, and M. F. Iskander, “An integrated method of ray tracing and genetic algorithm for optimizing coverage in indoor wireless networks,” IEEE Antennas and Wireless Propagation Letters, vol. 7, pp. 145-148, 2008.
[https://doi.org/10.1109/LAWP.2008.919358]

-
H. A. N. Obeidat and G. T. A. E. Sanousi, “Indoor propagation channel simulations for 6G wireless networks,” IEEE Access, vol. 12, pp. 133863-133876, 2024.
[https://doi.org/10.1109/ACCESS.2024.3443081]

- Y. Lee, K. Kim, and Y. Choi, “Optimization of AP placement and channel assignment in wireless LANs,” 27th Annual IEEE Conf. on Local Computer Networks, pp. 831-836, Nov. 2002.
-
R. -H. Wu, Y. -H. Lee, and S. -A. Chen, “Planning system for indoor wireless network,” IEEE Transactions on Consumer Electronics, vol. 47, no. 1. pp. 73-79, 2001.
[https://doi.org/10.1109/30.920422]

-
M. Kamenetsky and M. Unbehaun, “Coverage planning for outdoor wireless LAN systems,” International Zurich Seminar on Broadband Communications, p. 49, 2002.
[https://doi.org/10.1109/IZSBC.2002.991793]

-
S. Kouhbor, J. Ugon, A. Kruger, and A. Rubinov, “Optimal placement of access point in WLAN based on a new algorithm,” International Conference on Mobile Business (ICMB'05), 2005, pp. 592-598, Sydney, NSW, Australia.
[https://doi.org/10.1109/ICMB.2005.75]

-
Z. Yun, S. Lim, and M. F. Iskander, “An integrated method of ray tracing and genetic algorithm for optimizing coverage in indoor wireless networks,” IEEE Antennas and Wireless Propagation Letters, vol. 7, pp. 145-148, 2008.
[https://doi.org/10.1109/LAWP.2008.919358]

-
Y. Zhao, H. Zhou, and M. Li, “Indoor access points location optimization using differential evolution,” 2008 International Conference on Computer Science and Software Engineering, pp. 382-385, Wuhan, China, 2008.
[https://doi.org/10.1109/CSSE.2008.1539]

-
J. Jia, X. Wang, and J. Chen, “A genetic approach on cross-layer optimization for cognitive radio wireless mesh network under SINR model,” Ad Hoc Networks, vol. 27, pp. 57-67, 2015.
[https://doi.org/10.1016/j.adhoc.2014.11.020]

-
H. W. Son and N. H. Myung, “A Deterministic Ray Tube Method for Microcellular Wave Propagation Prediction Model,” IEEE Transactions on Antennas and Propagation, vol. 47, no. 8, pp. 1344-1350, Aug. 1999.
[https://doi.org/10.1109/8.791954]

-
A. Konak, D. W. Coit, and A. E. Smith, “Multi-objective optimization using genetic algorithms: A tutorial,” Reliability Engineering & System Safety, vol. 91, pp. 992-1007, 2006.
[https://doi.org/10.1016/j.ress.2005.11.018]

- D. E. Goldberg, Genetic Algorithms in Search, Operation, and Machine Learning, Addison-Wesley Publishing Company, Inc., 1989.
-
E. G. Villegas, E. Lopez-Aguilera, R. Vidal, and J. Paradells, “Effect of adjacent-channel interference in IEEE 802.11 WLANs,” in Proceedings of the 2nd International Conference on Cognitive Radio Oriented Wireless Networks and Communications, Orlando, FL, USA, pp. 118-125, 2007.
[https://doi.org/10.1109/CROWNCOM.2007.4549783]


