A study on flow analysis for smoke control equipment in Class B fires
Copyright © The Korean Society of Marine Engineering
This is an Open Access article distributed under the terms of the Creative Commons Attribution Non-Commercial License (http://creativecommons.org/licenses/by-nc/3.0), which permits unrestricted non-commercial use, distribution, and reproduction in any medium, provided the original work is properly cited.
Abstract
An explosion occurred during the ignition process of a Class B fire at a firefighting training facility for ship firefighting in N State, USA, resulting in injuries to an assistant instructor. Because this environment closely resembles fire scenarios on ships, it is essential to quantify safety measures to ensure occupant protection and establish operational standards. To evaluate fire safety, vector analysis was conducted using Pyrosim based on Fire Dynamics Simulator (FDS) to assess smoke and heat flow. The results were quantified and visualized to analyze the smoke control performance and its impact on occupant safety. To evaluate the effectiveness of the smoke control equipment, an automatic opening vent and exhaust nozzle were examined, and the smoke flow and temperature changes corresponding to each system were analyzed. Their findings demonstrated that both systems effectively prevented smoke and heat accumulation, thereby reducing additional risks. In particular, the automatic opening vents were confirmed to be more suitable for emergencies.
Keywords:
Smoke control equipment, Flow analysis, Fire, Pyrosim, FDS1. Introduction
On May 9, 2024, an explosion occurred during the ignition process of a fuel fire at a ship firefighting training facility in N State, USA. Consequently, an assistant instructor sustained severe burns and was rescued after a delayed evacuation [1].
According to the fire chief, the primary cause of the accident was insufficient ventilation, leading to the ignition of vaporized fuel gases. Additionally, the downward accumulation of smoke and heat hindered rescue operations and exacerbated the severity of injuries.
This incident highlighted the necessity of establishing a safer operational environment to ensure the safety of occupants in fire-suppression training facilities. In this study, the effectiveness of the existing and additional smoke control equipment for managing smoke and heat in uncontrolled Class B fires was analyzed.
Several previous studies have investigated fire dynamics using computational fluid dynamics (CFD). Koo and Choi analyzed the causes of fire and explosion incidents in enclosed storage tanks by examining the wind direction and vaporized fuel gas behavior using CCTV footage and CFD simulations [2].
Cho and Kim utilized Pyrosim and Pathfinder to assess the progression of cable fires and evacuation times in the main control room of a thermal power plant [3].
Choi and Kim employed Fire Dynamics Simulator (FDS) to reconstruct explosion hazards and secondary explosion scenarios by incorporating the combustion characteristics of acetone and dodecane, which have different flash points [4].
Building on these previous studies, herein, we simulate an uncontrolled fire scenario, similar to a facility in the N state, within a facility designed and operated for the same purpose as the incident site.
This study investigates the dispersion behavior of heat and smoke under such conditions and analyzes the associated risks as the fire progresses. The effectiveness of smoke control equipment in managing fluid dynamics during fire events is assessed by reflecting on the specific characteristics of Class B fires.
2. Research Method
2.1 FDS Modeling Conditions
In this study, FDS was used to analyze the smoke and heat flow behavior in fuel fires under various smoke control conditions. FDS is a CFD software optimized for fire, smoke, and heat transfer simulations based on the Navier–Stokes equations. The fire scenario was simulated for 300 s after ignition, and the resulting smoke and heat were analyzed [5].
First, a portable fire-training facility at the Korea Institute of Maritime and Fisheries Technology in the M region was selected as the simulation environment. This facility, specifically designed for shipboard fire response training, was modeled under conditions in which Class B fires occur and smoke and heat are not effectively controlled because of the non-operational state of the dust collector, with only the smoke barrier wall being active, similar to the situation at the facility in the N State.
In this study, a simulation scenario was developed assuming that the dust collector, originally intended to extract smoke and heat, was nonoperational, thereby replicating the uncontrolled fire conditions observed at the incident site. This scenario was designated as Case 1.
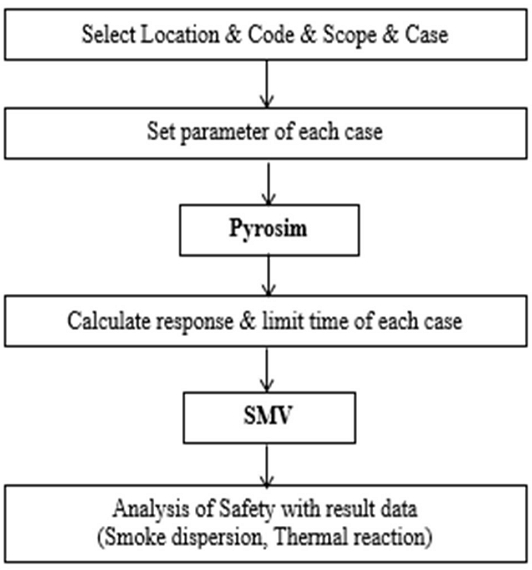
The research procedure is summarized in Figure 1. The simulation variables were set by adding two types of smoke control equipment: vertically ventilated exhaust equipment and horizontally ventilated exhaust equipment, in addition to the baseline condition. Pyrosim, which is based on the FDS model, was used to conduct simulations for each case, and numerical results such as the detector response time and threshold time were derived. Smokeview (SMV) was used to analyze smoke and heat responses.
Table 1 presents experimental conditions, including the dimensions of the simulation domain and specific heat capacity of air at an ambient temperature of 20 °C.
Based on these conditions and the results of Equation (4), 1,795,200 computational grid cells were used for modeling. Protruding structures were simplified during the modeling process for optimization [6].
| (1) |
| (2) |
| (3) |
| (4) |
Here, Q represents the heat release rate per unit area, D is the dimensionless characteristic diameter, dx is the grid cell size, T∞ denotes the absolute temperature of air, ρ∞ is the air density, g represents the gravitational acceleration, and Cp is the specific heat capacity of air.
Owing to the computational nature of the software, the accuracy of the simulation was highly sensitive to the grid size, and the computational time required for analysis varied significantly. The grid resolution was defined based on the ratio between the dimensionless characteristic diameter and the cell size.
To determine the appropriate grid size according to the heat release rate, the following approach was applied. Equation (2) was used to calculate the dimensionless characteristic diameter, which was then divided by the grid cell size. The default value was then applied to Equation (3) to estimate the optimal grid size range for calculating the heat release rate.
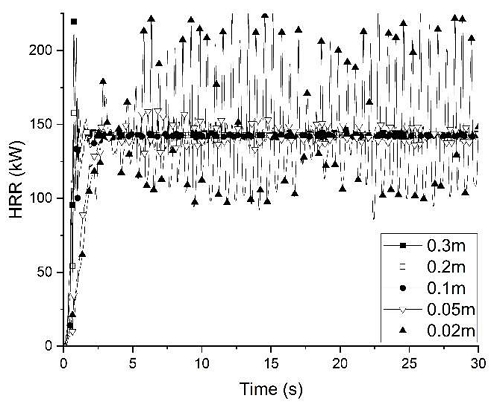
The optimized grid size range for the heat release rate is shown in Figure 2 [7].
The optimization process was conducted over 30 s, during which the grid size was set as a variable under a fixed heat release rate. The objective was to identify the grid size that converged to the heat release rate value. Based on accuracy verification and resolution optimization, a grid size of 0.1 m was selected for the simulation.
Table 2 lists the materials and properties defined based on the design drawings during the modeling process. The walls were concrete, the interior walls of the fire chamber were fire-resistant bricks, and the exhaust ducts were steel. The properties of identical materials were assigned their default values. In addition, the height, thickness, and length of the smoke barrier wall, as specified in the design drawings, were implemented accordingly [8].
The simulation variables included two types of smoke control equipment: a single automatic opening vent installed at the top of the training facility, and four exhaust nozzles mounted on the upper sidewalls. For thermal fluid analysis within the space, Pyrosim 2024.2.1209 was used for preprocessing in FDS to calculate the response and threshold times for each scenario, and SMV was used for post-processing to visualize the results [9]. Finally, the simulation results for smoke flow and heat response were analyzed to assess potential hazards with respect to the standard of life safety for occupants and facilities.
2.2 Governing Equations for Pyrosim Analysis
Pyrosim is a software tool designed to seamlessly integrate and enhance the capabilities of FDS. It is used to define fire sources, configure smoke control equipment, and analyze various parameters, such as smoke flow, heat transfer, velocity, temperature, carbon dioxide concentration, and toxicity. In this study, Pyrosim was used to evaluate the impact of smoke control equipment on smoke and heat flow behaviors during fuel fires [10].
For turbulence modeling, direct numerical simulation (DNS) can be used to resolve all eddies at all scales. However, considering computational efficiency, large eddy simulation (LES) was adopted in this study because it focuses on analyzing large-scale turbulent structures while modeling smaller eddies to optimize computational performance. In LES, eddies larger than the designated grid size are explicitly resolved, whereas smaller eddies are modeled to enhance computational efficiency. The governing equations used for turbulence analysis are presented in Equations (5)-(9).
| (5) |
| (6) |
| (7) |
| (8) |
Here, uj represents the velocity vector, ui denotes the transformation vector, τii is the turbulent stress, refers to the sub grid scale turbulent stress, fd,i is the fluid resistance force, represents the particle evaporation rate, fb is the external force, hs denotes the enthalpy associated with temperature changes, is the heat release rate per unit volume, refers to the particle heat release rate, and represents the heat flux due to conduction and radiation.
Equation (5) is the LES momentum equation, a fundamental equation in CFD that is used to analyze the flow behavior within the grid-based computational domain.
Equation (6) is the continuity equation, which is the basic equation used in the analysis, and represents the relationship between the mass flow rates. It models fluid flow based on the principle of mass conservation.
Equation (7) is the momentum conservation equation that describes the changes in momentum as a product of fluid mass and velocity. This equation is used to analyze the fluid flow behavior caused by fire-induced conditions.
Equation (8) is an energy conservation equation that analyzes the total energy changes resulting from the heat and smoke generation during a fire. It is used to calculate the fluid velocity and assess changes in fluid behavior owing to energy variations [11].
| (9) |
Here, P represents pressure, ρ denotes density, R is the gas constant, T represents temperature, and W refers to the molecular weight of the gas mixture.
Finally, Equation (9) shows the ideal gas equation used for the chemical reaction analysis. It describes the inversely proportional relationship between pressure and volume. This equation, which incorporates the molecular weight of the gas mixture, is particularly applicable under low-pressure and high-temperature conditions that are common in fire scenarios [12].
Table 3 summarizes the main functional models applied to the computational dynamics simulations. LES was used to resolve large-scale turbulent structures while modeling smaller eddies for computational efficiency. A mixture fraction-based combustion model was employed to calculate the combustion reactions based on the fuel–air mixing ratio. Radiative heat transfer was simulated using the finite-volume method, and smoke movement was modeled as buoyancy-driven flow induced by temperature-dependent density differences. Ventilation model was used natural only to simulate smoke and heat behavior, similar to actual uncontrolled fire environments. The heat conduction through the compartment boundaries was considered using solid-material conduction models. To ensure sufficient resolution, a computational grid was constructed using a uniform Cartesian mesh determined based on the characteristic fire diameter.
The boundary conditions were defined to reflect the geometry and airflow configuration of the training facility. Fixed boundaries were applied to the walls and ceilings, whereas vents and openings, such as skylights and fans, were set as pressure or velocity boundaries, depending on their operational state. The fire source was specified with defined heat release parameters to reproduce realistic fire behavior under uncontrolled conditions.
2.3 Parameter Conditions
In this study, three scenarios were established to analyze and compare smoke and heat flow behaviors under various smoke control conditions during a fire. To achieve this, scenarios were designed to simulate an emergency in which the dust collector had failed, leading to a loss of fire control. Under these conditions, the installation of additional smoke-control equipment was set as a variable.
Table 4 presents the three cases used in the analysis. Case 1 represents an incident in which the dust collector is not operational, leaving only the smoke barrier wall.
This case study analyzes the natural spread of smoke within the training facility. Case 2 applies the same conditions as Case 1 but adds an automatic opening vent installed at the top of the training facility to assess the effectiveness of the vertical smoke flow control. To optimize the size and number of vents, the area where heat and smoke leaked from the fire chamber in Case 1, which formed a laminar flow that accelerated upward, was measured. Based on the measured area and location, a single automatic opening vent with a size of 1.0 m2 was installed at the vertical smoke flow path. The vent was designed to open automatically when triggered by the smoke detector. [13].
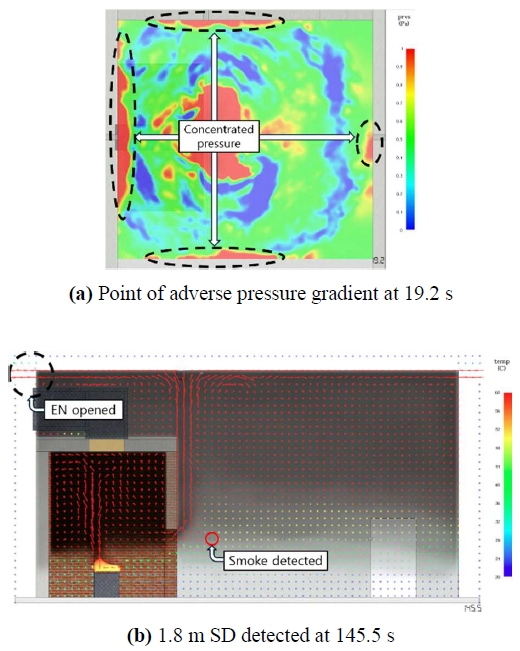
Case 3 also applies the same conditions as Case 1, but utilizes horizontal smoke flow control by installing exhaust nozzles along the upper sidewalls of the training facility. To optimize the location and number of nozzles, the heat and smoke flow patterns analyzed in Case 1 were used to identify the areas where the reverse pressure gradients were formed.
Based on this analysis, four exhaust nozzles with 0.25 m2 of total area were installed, resulting in the same total exhaust area as the automatic opening vent in Case 2. Similar to Case 2, these exhaust nozzles were designed to open automatically when triggered by the smoke detector at the top of the training facility. The performance of this equipment was analyzed and compared against that of other cases [14].
2.4. Evaluation Criteria for Risk Assessment
In this study, the performance of smoke control equipment was evaluated based on the Performance based design evaluation standard guidelines provided by the Korea Fire Agency [15].
Table 5 summarizes the occupant safety criteria specified in the guidelines. The key risk factors are categorized into four types: respiratory safety limit, thermal effects, visibility reduction, and toxicity effects [16]. The respiratory safety limit was set at a height of 1.8 m above the floor, where smoke detectors with an obscuration rate of 5 %/m were installed as fire-training facilities to measure the presence of smoke. At the same position, heat detectors and oxygen (O₂), carbon dioxide (CO₂), and carbon monoxide (CO) sensors were also installed to measure risk of respiratory exposure to toxic substances due to the presence of hazardous gases in smoke, concentration levels of these substances and the risk of inhalation burns caused by heat exposure.
3. Results and Discussion
3.1 Risk Assessment by Case
The quantified results of the smoke detection timing for each case are presented in Table 6. These results represent the time at which smoke detectors were activated in each scenario. The numerical differences between the smoke control equipment applied in each case were quantified based on the smoke detection timing to demonstrate the effectiveness of each smoke control equipment.
In Case 1, in which the dust collector was shut down during a fuel fire, a smoke detector was installed near the ceiling at a height of 6.5 m from the floor detected smoke at 19.8 s. The smoke then gradually descended, eventually reaching the detectors installed at the respiratory safety limit height of 1.8 m, where smoke was detected at 124.2 s.
In Case 2, the automatic opening of the vent was triggered based on the activation time of the ceiling detector as that in Case 1. In Case 3, the exhaust nozzles were similarly triggered at the same detection time. The smoke detectors installed at the respiratory safety limit height (1.8 m) and placed 1.0 m along the X axis from smoke barrier wall responded in both cases detected smoke after 249.8 and 145.5 s in Cases 2 and Case 3, respectively.
To further analyze the smoke and heat flow characteristics and visualize the differences caused by the smoke control equipment, the smoke flow was visualized at each detection time for the ceiling and respiratory safety limit detectors.
Visualizations were generated using SMV, with the viewpoint fixed to a 2D frontal cross-section for all cases. Using the Vector function of SMV, the heat distribution at each detection time was compared across cases, focusing on the temperature range from 20°C (ambient temperature) to 60°C, which is the threshold for inhalation burns.
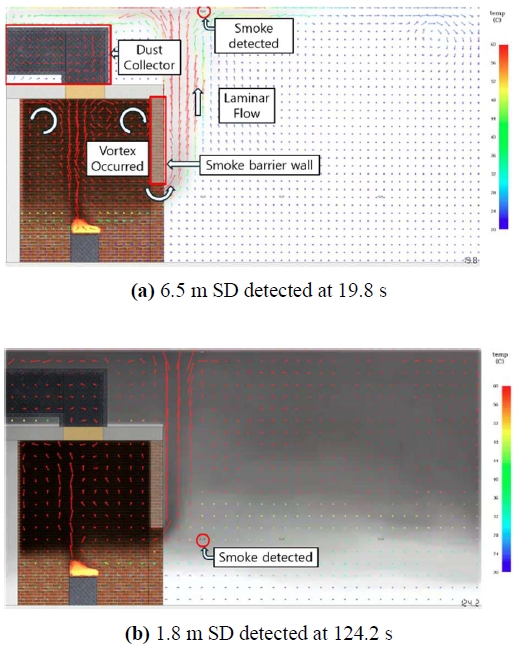
Figure 3 shows the temperature distribution for Case 1 at each critical time point, as viewed from the 2D frontal cross-section.
(a) illustrates the flow behavior at 19.8 s, which is the detection time of the ceiling smoke detector in Case 1. In this scenario, when the dust collector installed at the top of the fire chamber was inactive, the fire-induced upward flow caused heat and smoke to accumulate at the height of the smoke barrier wall. Owing to this accumulation, vortices were formed near the inner upper boundary of the fire chamber. As the descending smoke flow crossed the smoke barrier wall, it formed a vertical laminar flow with increasing temperature, pressure, and velocity, eventually reaching the upper part of the facility.
(b) illustrates the flow behavior at 124.2 s, the detection time of the smoke detector installed at the respiratory safety limit (1.8 m above the floor). At this point, the accumulated smoke reached the breathing zone, and the temperature exceeded 50°C, indicating that thermal exposure posed a secondary hazard to occupants.
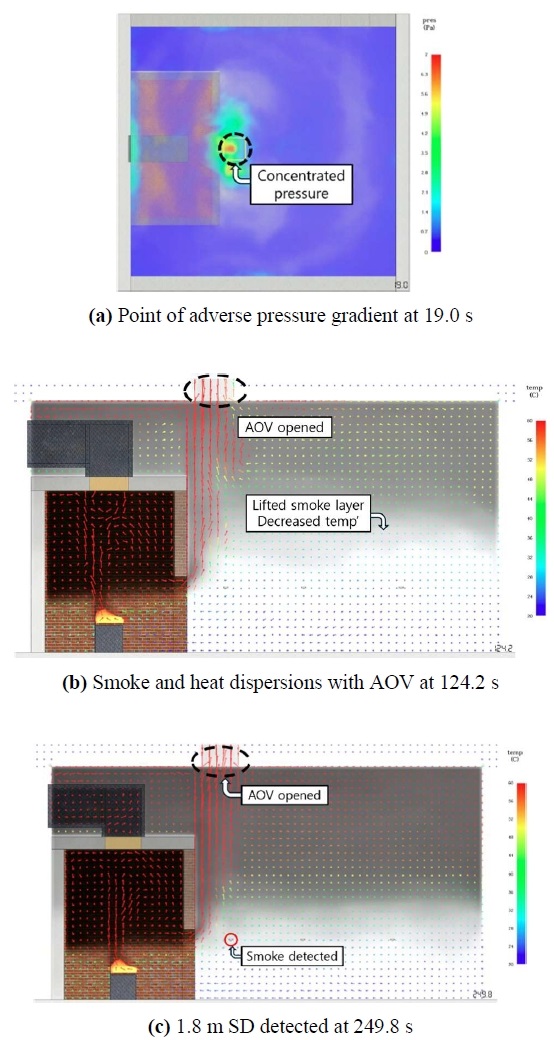
Figure 4 shows the pressure and temperature distributions for Case 2 viewed from both the top and front 2D cross-sections at each critical time point.
(a) illustrates the flow behavior at 19.0 s, which represents the condition before the automatic opening vent was activated. This visualization, captured at a height of 6.5 m, shows the formation of a reverse pressure gradient area. The laminar flow was formed when the fire-induced airflow reached the upper part of the training facility. It collided with the ceiling, generating a pressure-rise zone. Based on this analysis, the automatic opening vent was installed at this location. (b) shows the flow behavior at 124.2 s after the vent opened, to compare with Case 1. At this point, the smoke layer lifted, and the air temperature decreased compared to Case 1. (c) shows the flow behavior at 249.8 s, after the automatic opening vent was triggered and the smoke descended to the respiratory safety limit. Heat and smoke were discharged at a high flow rate through the vent, which was installed at an optimal location to minimize flow resistance.
The overall flow characteristics were similar to those in Case 1 except for the upward flow through the vent. However, because of the installation of the dust collector, the temperature was lower than that in Case 1, and an additional 125.6 s of evacuation time was secured, demonstrating the performance improvement achieved by the system.
Figure 5 shows the pressure and temperature distributions for Case 3 viewed from both the top and front 2D cross-sections at each critical time point.
(a) illustrates the flow behavior at 19.2 s, which represents the condition before the exhaust nozzles were activated. This visualization, observed at a height of 6.5 m, focused on the reverse pressure gradient areas, where four exhaust nozzles were installed symmetrically.
The upward flow first collided with the ceiling, spread horizontally along the ceiling surface, and then collided with the sidewalls, forming pressure-rise zones at these locations.
(b) shows the flow behavior at 145.5 s, after the exhaust nozzle were activated and the smoke descended to the respiratory limit line.
According to the numerical results, an additional 21.3 s of evacuation time was secured compared to Case 1.
The analysis also revealed that at the respiratory safety limit, the smoke reached the detectors 104.3 s earlier than in Case 2. This numerical difference indicates that under identical exhaust areas, the vertical smoke flow generated by the automatic opening vent in Case 2 was more effective than the horizontal smoke flow induced by the exhaust nozzles in Case 3.
The flow analysis demonstrated that under the same exhaust area conditions, the vertical flow was more efficient for smoke exhaust than the horizontal flow.
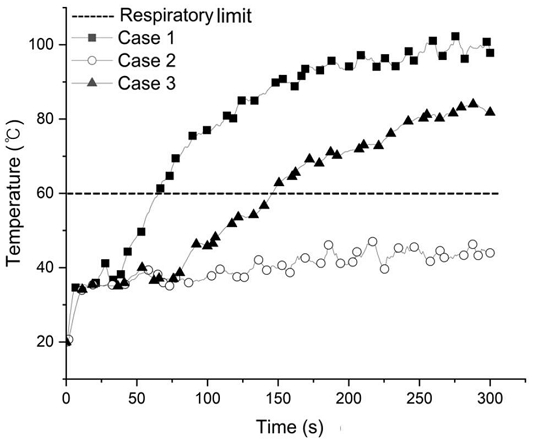
Figure 6 shows the temperatures at the respiratory safety limit height (1.8 m) measured at the same position as the first smoke detector that detected the smoke in each case. This allowed for a direct comparison of temperatures across different cases.
In Case 1, in which no dust collector was installed, the temperature reached a maximum of 102.8°C, and the respiratory limit exposed to risk of inhalation burns was 65.7 s.
In Case 2, where the automatic opening vent was installed, the temperature remained at approximately 40°C, confirming that there was no risk of inhalation burns throughout the 300-s duration.
In Case 3, where exhaust nozzles were installed, the temperature exceeded 60°C after 145.8 s, eventually reaching a maximum of 84.0°C.
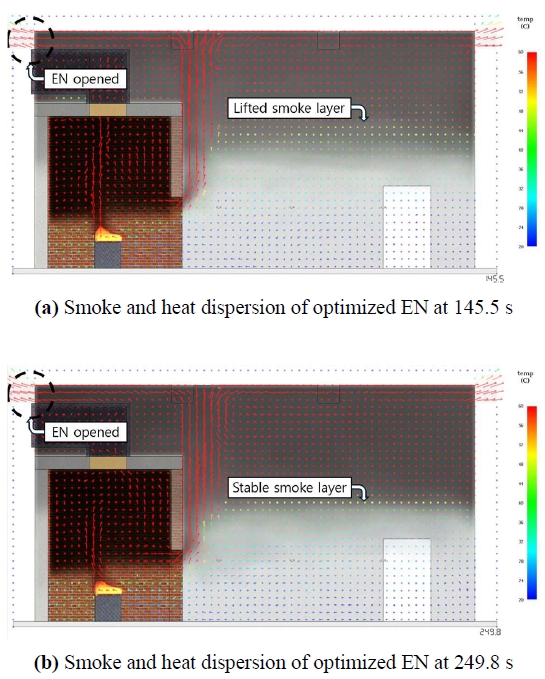
Figure 7 shows the smoke layer with the temperature and optimized EN, viewed from the front 2D cross-sections at the detection point of each case.
(a) Illustrates the flow behavior with smoke layer at 145.5 s for comparison with Case 3. At this point, the smoke layer lifted with a more stable condition than (b) of Figure 5.
(b) shows the stabilized smoke layer with flow behavior at 249.8 s, representing the condition after the optimized exhaust nozzle is triggered, compared with (C) of Figure 4.
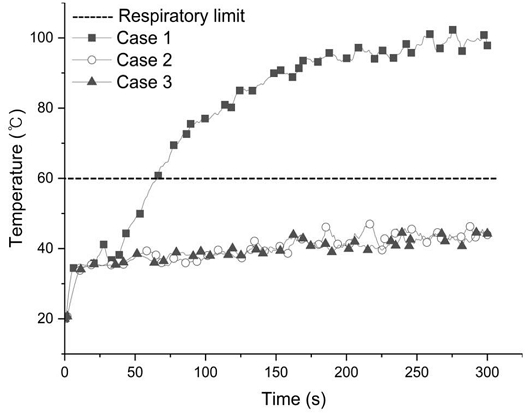
Figure 8 shows the temperatures at the respiratory safety limit height (1.8 m) for each case, similar to that shown in Figure 6, but with the exhaust nozzle area set to optimize the smoke temperature. To achieve an effect similar to vertical flow, the total area of the exhaust nozzles was set to be 4.8 times larger than that of the automatic opening vent. The results confirmed that the exhaust nozzles achieved comparable thermal performances in terms of temperature and response time. However, the efficiency was lower than that when the area was increased.
This suggests that horizontal-flow-based exhaust systems can be considered in situations where the design makes it difficult to apply vertical-flow-based exhaust systems.
4. Conclusion
This study simulated emergency situations that could occur at a portable firefighting training facility, and analyzed smoke and heat flow behaviors under different smoke control conditions using additional smoke control systems as variables. The results obtained from these simulations were compared and evaluated to assess the performance of each system. Fire and smoke flow analyses were conducted using Pyrosim based on the FDS to confirm the effect of each smoke control system on smoke dispersion and temperature rise control.
- 1. In Case 1, in which no smoke control system was installed, the smoke spread rapidly and the smoke detector at the respiratory safety limit was triggered at 124.2 s. This case provided a baseline evacuation time for occupants under emergency conditions in which the dust collection system fails.
- 2. In Case 2, in which an automatic opening vent was installed, smoke was exhausted using a vertical upward flow. The smoke detector at the respiratory safety limit was triggered at 249.8 s, securing an additional 125.6 s compared with Case 1. Furthermore, Case 2 demonstrated a 104.3s improvement compared with Case 3, in which exhaust nozzles were applied.
- 3. In Case 3, exhaust nozzles were installed, and smoke was exhausted using a horizontal flow. The smoke detector at the respiratory safety limit was triggered at 145.5 s. The temperature at the respiratory safety limit exceeded 60°C after 145.8 s, indicating that horizontal flow control was relatively less effective than vertical flow control.
- 4. The performance comparison between the automatic opening vent and exhaust nozzles (with a total area 4.8 times larger) revealed that both equipment exhibited similar thermal and temporal performances. However, the automatic opening vent achieved this performance with a considerably smaller area, confirming that vertical flow-based smoke exhaust was more efficient and effective as emergency smoke control equipment.
This study quantitatively assessed the safety of a portable firefighting training facility in emergency scenarios, demonstrating the performance of existing smoke control equipment and suggesting potential risk reduction through the application of additional equipment. Furthermore, the findings of this study can be applied not only to firefighting training facilities, but also to engine room fires on ships, particularly in scenarios involving skylights and exhaust fans. A comparison between vertical and horizontal flow behaviors is expected to contribute meaningfully to the development and improvement of onboard fire suppression systems and related research.
As a numerical analysis using software under idealized conditions and restricted cases, this study may involve discrepancies from actual scenarios. Therefore, future studies incorporating experimental comparisons are necessary to enhance the applicability and validity of these findings. However, it can serve as a baseline reference for understanding smoke and heat flow behaviors in fuel fires, evaluating the performance of smoke control equipment, and proposing additional equipment. These findings can also be applied to improve the design of existing training facilities or develop new firefighting training facilities.
Author Contributions
Writing-Original Draft Preparation, Conceptualization, Software, Formal Analysis, Data Curation, Visualization, D. Y. Park; Writing-Review & Editing, Investigation, M. H. Song; Supervision, Project Administration, J. H. Kim.
References
- ABC 7 News, Fire Service Academy instructor survives after training session goes up in flames, https://abc7ny.com/post/14790111, , 2024.
-
C. C. Koo and J. W. Choi, “Analysis of cause of fire and explosion in internal floating roof tank: Focusing on fire and explosion accidents at the OO oil pipeline corporation,” Fire Science and Engineering, vol. 34, no. 2, pp. 86-93, 2020 (in Korean).
[https://doi.org/10.7731/KIFSE.2b5ff251]

-
Y. S. Cho, D. M. Kim, and K. T. Lim, “Risk assessment through fire and evacuation simulation in the main control room of a domestic thermal power plant,” Fire Science and Engineering, vol. 35, no. 6, pp. 68-74, 2021 (in Korean).
[https://doi.org/10.7731/KIFSE.74b49af9]

-
Y. Y. Choi, S. Y. Kim, K. N. Jeon, T. W. Kim, and B. C. Choi, “Numerical simulation of evaporative gas behavior inside fuel tank during fire extinguishing process,” Fire Science and Engineering, vol. 38, no. 4, pp. 10-19, 2024.
[https://doi.org/10.7731/KIFSE.c1c93a12]

- K. S. McGrattan, J. F. Hostikka, M. Vanella, R. McDermott, and E. Mueller, Fire Dynamics Simulator Technical Reference Guide, NIST Special Publication 1018-1, Sixth Edition, 2024.
- Korea Energy Economics Institute, Energy Calorific Conversation, 2025.
- K. S. McGrattan, J. F. Hostikka, M. Vanella, R. McDermott, and E. Mueller, Fire Dynamics Simulator User’s Guide, NIST Special Publication 1019, Sixth Edition, 2024.
-
S. J. Lim, D. H. Woo, and Y. H. Lee, “Numerical analysis on extinguishing of sprinklers in a hydrogen pool fire,” International Journal of Hydrogen Energy, vol. 54, pp. 118-126, 2024.
[https://doi.org/10.1016/j.ijhydene.2023.05.178]

- Thunderhead Engineering, Pyrosim Results User’s Manual, 2024-2 Version, 2024.
- Thunderhead Engineering, Pyrosim User’s Manual, 2024-2 Version, 2024.
-
B. Kim and K. I. Hwang, “A study on prediction and improvement method of fire risk for a newly built college dormitory,” Journal of the Korean Society of Marine Engineering, vol. 40, no. 3, pp. 228-234, 2016 (in Korean).
[https://doi.org/10.5916/jkosme.2016.40.3.228]

-
B. C. Choi, “Numerical study on natural convection heat transfer inside rectangular enclosures in the insulation of a membrane-type LNG cargo containment system,” Journal of the Korean Society of Marine Engineering, vol. 43, no. 4, pp. 244-253, 2019 (in Korean).
[https://doi.org/10.5916/jkosme.2019.43.4.244]

-
Y. C. Ha and J. K. Seo, “Applicability of CO2 Extinguishing System for Ships,” Journal of the Society of Naval Architects of Korea, vol. 54, no. 4, pp. 294-300, 2017.
[https://doi.org/10.3744/SNAK.2017.54.4.294]

-
B. Kim and K. I. Hwang, “Smoke exhaust performance prediction according to air supply and exhaust conditions for shipboard fires from a human safety point of view,” Journal of the Korean Society of Marine Environment & Safety, vol. 22, no. 7, pp. 782-790, 2016 (in Korean).
[https://doi.org/10.7837/kosomes.2016.22.7.782]

- National Fire Agency, Standard Guidelines for Performance-Based Design Evaluation and Operation, Standard of Occupant Life Safety, 2024.
-
S. M. Lee, H. Y. Kim, B. Kim, and K. I. Hwang, “Diffusion characteristics based on the gas leakage direction and air change per hour in a enclosed space on board a ship,” Journal of the Korean Society of Marine Environment & Safety, vol. 30, no. 2, pp. 165-175, 2024 (in Korean).
[https://doi.org/10.7837/kosomes.2024.30.2.165]


