Study on physical modeling and simulation of a maritime substantiation vessel for verifying the operational efficiency of a rotor sail
Copyright © The Korean Society of Marine Engineering
This is an Open Access article distributed under the terms of the Creative Commons Attribution Non-Commercial License (http://creativecommons.org/licenses/by-nc/3.0), which permits unrestricted non-commercial use, distribution, and reproduction in any medium, provided the original work is properly cited.
Abstract
Under the environmental regulations of the International Maritime Organization (IMO), operating ships are required to reduce greenhouse gas emissions annually. Existing ships must achieve approximately a 20% reduction in energy efficiency compared to the baseline by 2023. Additionally, the Carbon Intensity Indicator (CII) must improve by 1% annually from 2020 to 2022 and by 2% annually from 2023 to 2026, compared to 2019 levels. In response, shipping companies and shipyards are showing significant interest in various technologies to improve the operational efficiency of existing ships, particularly in rotor sail technology, which can be installed through retrofitting. This study verified the total fuel reduction rate achievable by installing a 3-meter rotor sail on the multi-purpose offshore demonstration vessel being constructed by the Korea Marine Equipment Research Institute (KOMERI) through simulation. To achieve this, models were developed for the 3-meter rotor sail, the governor, diesel engine, propeller, and the multi-purpose offshore demonstration vessel. The simulation results confirmed a fuel-saving effect of 10.12%.
Keywords:
Rotor sail, Maritime substantiation vessel, Physical modeling, Fuel reduction rate1. Introduction
The International Maritime Organization (IMO) adopted the Initial IMO Strategy on the Reduction of Greenhouse Gas (GHG) Emissions from Ships in 2018 to reduce GHG emissions from the maritime sector. This initial strategy set a target to reduce GHG emissions from international shipping by 50% by 2050 compared to 2008 levels. In 2023, during the 80th session of the Marine Environment Protection Committee (MEPC), the IMO adopted the 2023 IMO Strategy on Reduction of GHG Emissions from Ships (2023 Strategy), which revised and enhanced the initial strategy’s goals. The 2023 Strategy aims to achieve net-zero GHG emissions in the maritime sector by 2050.Additionally, during the 76th session of the MEPC in June 2021, amendments to MARPOL Annex VI were adopted, expanding GHG emission regulations from new ships (newbuilds) to include existing ships. As a result, the Energy Efficiency Existing Ship Index (EEXI) and the Carbon Intensity Indicator (CII) came into effect in November 2022.The EEXI quantifies CO2 emissions per unit of cargo transported (1 ton) and per unit of distance traveled (1 nautical mile) based on engine power, providing a pre-operational efficiency benchmark. Ships are required to achieve approximately a 20% reduction compared to baseline values by 2023. The CII measures CO2 emissions during operations, based on voyage records and fuel consumption, expressed per unit of cargo transported and distance traveled.
The CII must improve by 1% annually from 2020 to 2022 compared to 2019 levels and by 2% annually from 2023 to 2026.
Shipping companies are increasingly focused on developing technologies that can immediately enhance the operational efficiency of ships. Technologies to improve the operational efficiency of ships include the use of eco-friendly fuels and systems such as shaft generators that utilize wasted energy to aid propulsion. However, these technologies face significant challenges when being retrofitted onto existing vessels. As a result, there is growing interest in rotor sails, which can be more easily installed through retrofitting. Rotor sails utilize the Magnus effect, which generates thrust through the pressure difference created when wind blows against a rotating cylindrical structure (outer body). When installed on a ship, rotor sails can achieve fuel savings of approximately 6–8% [1]-[2].
In this study, the total fuel reduction rate achievable by installing a 3-meter rotor sail on the multi-purpose offshore demonstration vessel being constructed by the Korea Marine Equipment Research Institute (KOMERI) was calculated through simulation. For the calculation, a model of the multi-purpose offshore demonstration vessel without the 3-meter rotor sail was created. Subsequently, the same vessel equipped with the 3-meter rotor sail was modeled under identical input conditions, and the results were compared. The detailed models include components such as the governor, main engine, propeller, shaft, rotor sail, and ship model. After completing the modeling, simulations were conducted using MATLAB Simulink to verify the fuel reduction rate.
2. Modeling of the Maritime Substantiation Vessel
2.1 Specification Analysis of the Maritime Substantiation Vessel
The multi-purpose maritime substantiation vessel is being constructed to establish a market entry foundation for domestic equipment companies that have completed product development and land-based verification but are facing difficulties entering the market due to the lack of a track record for vessel application. Once the vessel is completed, it will operate on a regular route between Pohang and Donghae, helping the equipment companies secure a continuous track record and enhance their technological capabilities.
To simplify the modeling, the vessel is composed of a main engine, shaft, and propeller. Table 1 below summarizes the specifications of the multi-purpose maritime substantiation vessel. The cargo weight of the multi-purpose maritime substantiation vessel is 17,000 metric tons. The vessel's overall length is 132 meters, with a length between perpendiculars of 126 meters, a beam of 23 meters, a depth of 13.5 meters, and a draft of 9.5 meters. The vessel has a speed of 11.5 knots and is equipped with a MAN 6S35ME-GI 9.7 main engine. It also has three 690 kW generators.
2.2 Configuration of a Multi-Purpose Maritime Substantiation Vessel Model with the Application of a Rotor Sail
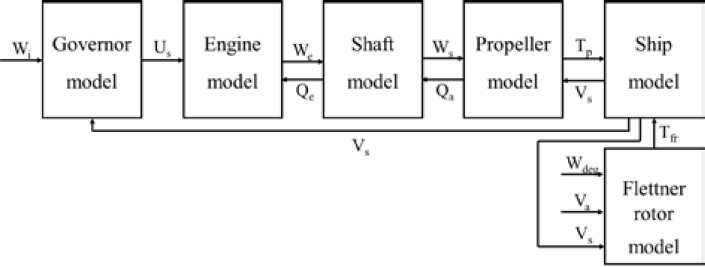
The multi-purpose maritime substantiation vessel model with the application of a rotor sail is configured as shown in Figure 1 below.
The governor model is a device that controls the rotational speed of the main engine. It takes the set ship speed (Wi) and the actual ship speed (Vs) as input values, and outputs the fuel injection amount (Us). The engine model takes the fuel injection amount from the governor model and the shaft load torque (Qe) from the shaft model as input values, and outputs the engine speed (We).
The shaft model takes the engine speed from the main engine model and the load torque (Qa) from the propeller model as inputs. Based on the torque value, it outputs the shaft load torque delivered to the engine model and the shaft rotational speed (Ws) delivered to the propeller model. The propeller model is calculated based on the shaft rotational speed and the ship speed from the ship model, and it outputs the propeller's rotational torque (Tp) and the load torque for the propeller model.
The ship model is configured to output the ship speed based on the propeller's rotational torque and the torque (Tfr) from the Flettner rotor model. The Flettner rotor model takes the wind direction (Wdeg) and wind speed (Va) as inputs, with the output being the torque value of the Flettner rotor model.
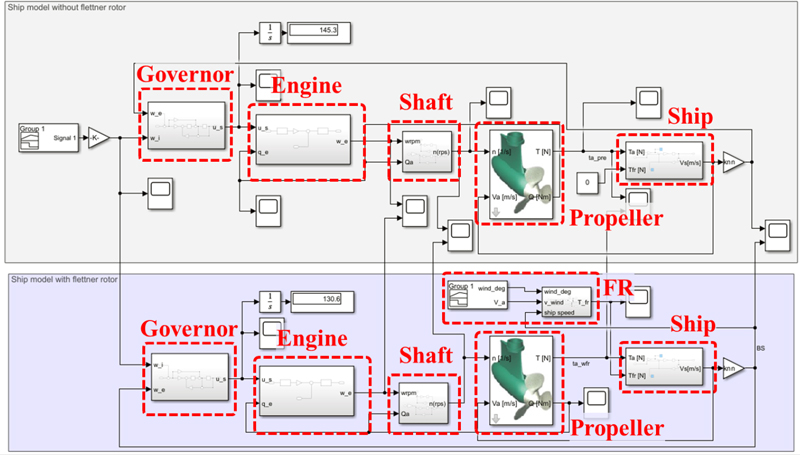
Figure 2 below shows the model of the multi-purpose maritime substantiation vessel using Matlab-Simulink. The model is designed to compare fuel consumption rates: the purple box at the top represents the existing multi-purpose maritime substantiation vessel model, while the gray box at the bottom represents the model with the application of a rotor sail. The governor model, engine model, shaft model, and propeller model are configured identically in both models, with the rotor sail model including an additional Flettner rotor model.
Additionally, the ship model has an increased weight equivalent to the weight of the rotor sail in the model with the rotor sail applied. An integrator has been installed at the output of the governor model in this model to measure fuel consumption, allowing the accumulated value of the consumed fuel to be tracked.
2.3 Modeling of the multi-purpose maritime substantiation vessel governor model
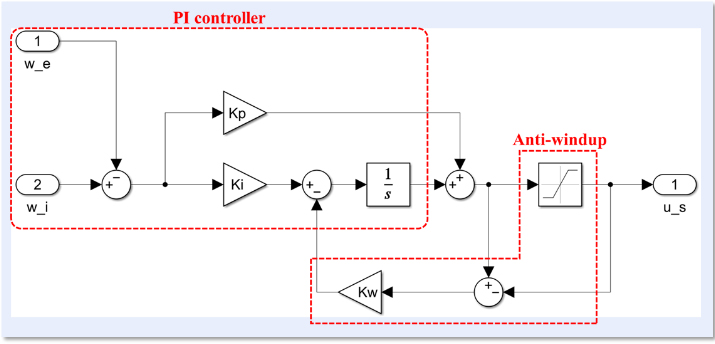
The governor model of the multi-purpose maritime substantiation vessel was modeled using a PI controller. Figure 3 shows the modeling of the governor model.
The input values for the governor model are the set ship speed (Wi) and the output ship speed (Vs), and the output value is the fuel injection amount (Us). Here, the fuel injection amount is limited to a range between 0 and 1, and to prevent error accumulation due to integration in a saturated state, anti-windup has been added. Equations (1) and (2) below are the formulas for the governor model.
| (1) |
| (2) |
Here, Wi is the set speed of the governor, and Vs is the output speed of the ship. Additionally, Kp is the proportional gain, Ki is the integral gain, Kw is the anti-windup gain, Umax is the maximum fuel injection amount, and Umin is the minimum fuel injection amount. Finally, Us is the output value of the governor, which is the fuel injection amount. The proportional gain (Kp) is set to 1.8, the integral gain (Ki) is set to 0.5, the anti-windup gain (Kw) is set to 0.2, the maximum fuel injection amount (Umax) is set to 1, and the minimum fuel injection amount (Umin) is set to 0.
2.4 Modeling of the Main Engine Model of the Multi-Purpose Maritime Substantiation Vessel
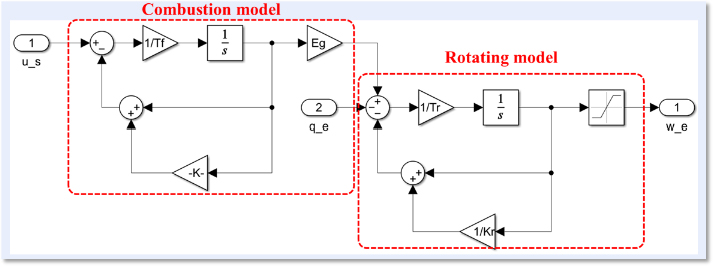
The modeling of the vessel's main engine has been extensively studied, and generally, the engine is divided into combustion and rotational systems. The combustion system is modeled as a first-order element reflecting pure delay time, while the rotational system is also modeled as a first-order element, and the entire system is modeled as a non-oscillatory second-order system [3]-[6]. In this study, although the target vessel is equipped with a dual-fuel engine, both the pre- and post-installation models of the rotor sail use the same vessel model. Therefore, for the sake of simplification, the vessel was modeled using the aforementioned non-oscillatory second-order system model. Figure 4 below shows the modeling of the main engine model.
The main engine model consists of a combustion system model and a rotational system model. The fuel injection amount (Us), the output value of the governor, is used as the input for the combustion system model, and the torque generated here is transmitted to the rotational system model. The rotational system model takes the load torque value (Qe) from the shaft model and the torque value from the combustion system model as inputs, and the engine's rotational speed (We) is output. The combustion and rotational system models are expressed by the following equations (3) and (4).
| (3) |
| (4) |
Here, Q(s) represents the torque value of the combustion system model, and We(s) represents the rotational speed value of the rotational system model. In the combustion system model equation, the proportional gain (Ke) is set to 2, and the combustion system time constant (Tf) is set to 6.5. In the rotational system model equation, the proportional gain (Kr) is set to 0.08, and the rotational system time constant (Tr) is set to 0.05.
2.5 Modeling of the Flettner Rotor Model
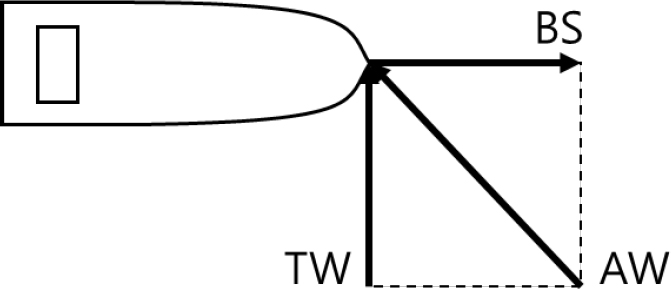
To model the rotor sail, the input values for the rotor sail must first be defined. The wind speed and wind direction defined here are the true wind speed (TWS) and true wind angle (TWA). To apply the wind speed and wind direction relative to the moving ship, the apparent wind speed (AWS) and apparent wind angle (AWA) must be used. Figure 5 below explains the relationship between true wind speed, true wind angle, apparent wind speed, and apparent wind angle based on the ship's speed.
When the ship is propelled at a speed and direction of BS and a wind of TW blows, the wind affecting the ship becomes AW. The apparent wind direction and apparent wind speed are given by Equations (5) and (6) as follows:
| (5) |
| (6) |
Here, AWA is the apparent wind angle, AWS is the apparent wind speed, TWA is the true wind angle, TWS is the true wind speed, and BS is the ship's speed. The Apparent Wind Angle (AWA) was calculated using the vector summation of the ship's speed and direction, the True Wind Direction (TWD), and the True Wind Speed (TWS). The Apparent Wind Speed (AWS) is determined by applying the Pythagorean theorem to the magnitudes of the true wind speed and the ship's speed.
To calculate the output torque (Tfr) of the rotor sail, the thrust coefficient (CT) must first be calculated. In this paper, the thrust coefficient from the work of Ruihua Lu & Jonas W. Ringsberg was used [7]. Figure 6 below shows the modeling of the Flettner rotor model.
The input values for the Flettner rotor model are the true wind speed (TWS), true wind angle (TWA), and ship speed (Vs), and the output value is the output torque (Tfr). The output torque is calculated using Equation (7) as shown in the model.
| (7) |
In the equation, ρ is the air density, AWS is the apparent wind speed, and S is the area of the rotor sail.
2.6 Modeling of the Shaft, Propeller, and Ship Model
The shaft model and propeller model apply the Open-water propeller characteristics model proposed by NTNU [8]-[11]. The shaft model takes the rotational speed (We) from the main engine and the load torque (Qa) from the propeller as inputs and outputs the shaft rotational speed (Ws). The propeller model takes the shaft rotational speed and the ship speed as inputs and outputs the propeller's rotational torque (Tp) and load torque.
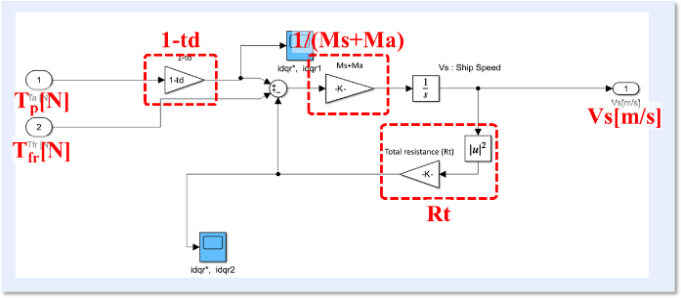
Figure 7 below shows the modeling of the ship model.
The ship model takes the propeller's rotational torque and the output torque from the Flettner rotor model as inputs, and outputs the ship speed. The ship model is represented by Equation (8).
| (8) |
Ms and Ma are the ship's weight and additional weight due to fluid dynamics, Vs is the ship's speed, td is the thrust coefficient, Tp is the propeller's rotational torque, RT is the total resistance acting on the hull, and finally, TFR is the output torque from the Flettner rotor model. Here, the ship's speed is modeled to increase in inverse proportion to Ms and Ma, and in direct proportion to Tp. Additionally, as the ship's speed increases, the total resistance acting on the hull is modeled to increase accordingly. Furthermore, the modeled Flettner rotor system was designed to include the additional output torque, as shown in Figure 6.
3. Simulation Results
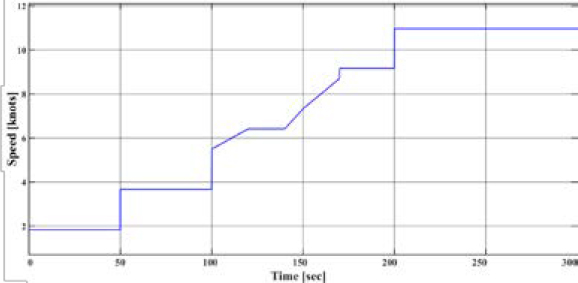
The simulation was analyzed for various ship speeds between 0 and 300 seconds. Figure 8 shows the set ship speeds for different operating scenarios.
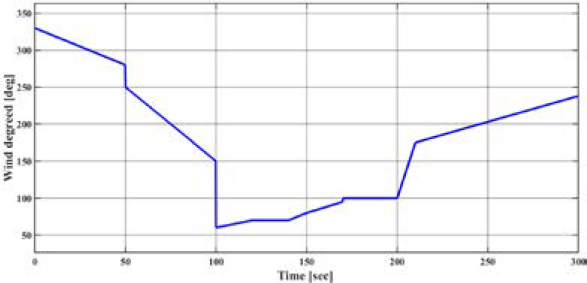
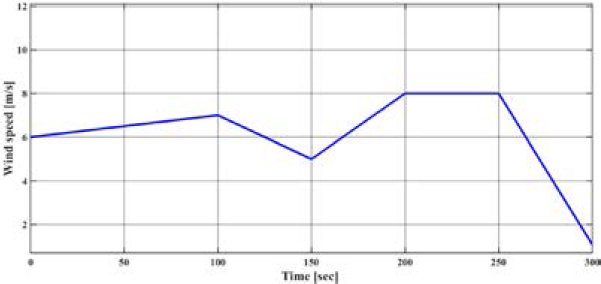
The set rotational speeds were as follows: 0-50 seconds 1.8[knots], 50-100 seconds 3.7[knots], 100-200 seconds 3.7-9.2[knots], and 200-300 seconds 11[knots]. Notably, the ship's most frequently operated speed range, 11[knots], was set to 40% of the total operating range. The ship speeds defined in the simulation were determined based on interviews with operators of multipurpose offshore demonstration vessels, representing the speed ranges of the entire fleet as proportions. Figure 9 and Figure 10 below shows the inputs for true wind direction and true wind speed.
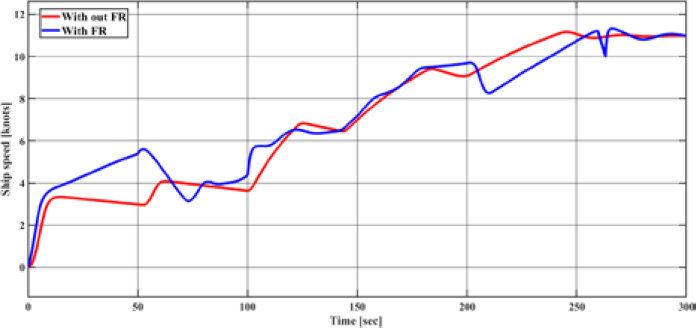
The True Wind Direction (TWD) and True Wind Speed (TWS) were defined as input values for the model by analyzing the annual average wind speed and wind direction in the East Sea and Pohang, the routes taken by the multipurpose offshore demonstration vessel, using data from the Meteorological Data Open Portal. Figure 11 below shows the ship speed (Vs).
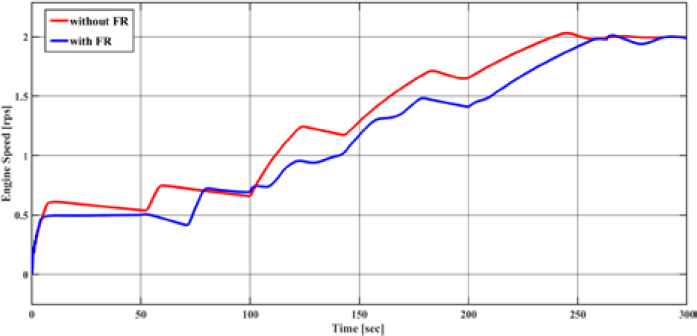
The red line represents the ship speed without the rotor sail, while the blue line represents the ship speed with the rotor sail. It can be observed that in the low-speed section, the output speed exceeds the control speed due to the influence of the wind. Figure 12 shows the main engine output rotational speed (We).
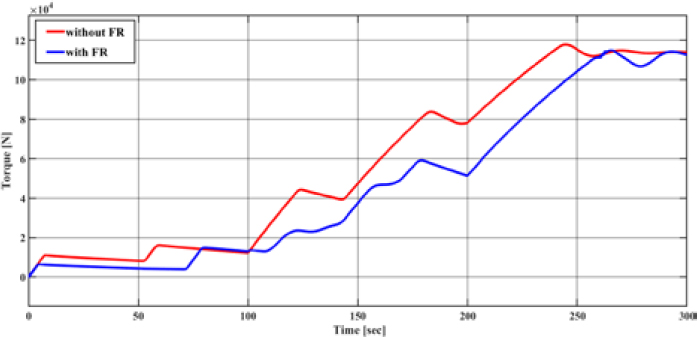
In the section after 250 seconds, where there is little wind, the engine rotational speeds are nearly identical. However, before 250 seconds, it can be seen that the engine rotational speed of the ship with the rotor sail is lower. This occurs when the True Wind Direction (TWD) has an angle between 180deg and 200deg and the True Wind Speed (TWS) is 8 m/s, resulting in the highest rotor sail torque between 200 and 250 seconds. Additionally, after 250 seconds, the True Wind Speed drops sharply to 1 m/s, and it was observed that the rotor sail torque also decreases drastically. Figure 13 shows the propeller rotational torque (Tp).
Similarly, in the section after 250 seconds with little wind, the propeller's rotational torque values are almost identical.
4. Conclusion
In this paper, models of the governor, main engine, shaft, propeller, and ship of the multi-purpose maritime substantiation vessel were created, and simulations were conducted to verify fuel consumption rates through the use of rotor sails. The simulation results showed that the total fuel consumption rate for the vessel without rotor sails was 145.3, while the vessel with rotor sails had a total fuel consumption rate of 130.6, indicating a fuel reduction effect of approximately 10.12%.
This paper does not address the generator power consumption associated with rotor sail operation, nor does it apply the thrust coefficient of the 3-meter rotor sail that would be used on the actual vessel. Future research will include these two aspects in the development of the vessel model.
Acknowledgments
This work was supported by the Technology Innovation Program (20024863, Development of demonstration technology for wind power propulsion system for ship operation energy saving) funded By the Ministry of Trade Industry & Energy(MOTIE, Korea).
Author Contributions
Conceptualization, S. D. Kim and J. H. Kim; Methodology, S. D. Kim and J. H. Kim; Software, S. D. Kim; Formal Analysis, S. D. Kim; Investigation, S. J. Yun; Resources, S. J. Yun; Data Curation J. H. Kim; Writing-Original Draft Preparation, S. D. Kim; Writing-Review & Editing, J. H. Kim; Visualization, S. D. Kim; Supervision, S. D. Kim; Project Administration, S. D. Kim and J. H. Kim; Funding Acquisition, J. H. Kim.
References
-
W. Sun, L. Xiyang, and L. Yang, “An optimization method for economical ship-routing and ship operation considering the effect of wind-assisted rotors,” Proceedings of the ASME 2020 39th International Conference on Ocean, Off-shore and Arctic Engineering, 2020.
[https://doi.org/10.1115/OMAE2020-18776]

-
C. Guzelbulut and K. Suzuki, “Optimal design of rotor sails based on environmental conditions and cost,” Journal of Marine Science and Engineering, vol. 12, no. 1, 2023.
[https://doi.org/10.3390/jmse12010031]

- M. J. Kang, J. M. Cheon, Y. S. Park, and H. K. Yoon, “Development of hardware in-the-loop simulation for test-ing control system of unmanned surface vehicle,” Conference of the Korean Institute of Electrical Engineers, Gyeongju: Korea, pp. 103-104, 2019.
- T. J. Lee, J. M. Jo, C. H. Shin, and H. J. Cha, “50kW Die-sel generator modeling and stand-alone mode analysis,” Conference of the Korean Institute of Power Electronics, Yesan: Korea, pp. 147-148, 2015.
- J. T. Hwang, S. Y. Hong, H. W. Kwon, K. K. Lee, and J. H. Song, “Dual fuel generator modeling and simulation for development of PMS HILS,” The Korea Institute of Information and Communication Engineering, vol. 21, no. 3, pp. 613–619, 2017.
- H. H. Yoo and J. S. Ha, “Speed control of a diesel engine by means of the model matching method,” Journal of Advanced Marine Engineering and Technology, vol. 20, no. 3, pp. 263-268, 1996.
-
R. Lu and J. W. Ringsberg, “Ship energy performance study of three wind-assisted ship propulsion technologies including a parametric study of the Flettner rotor technolo-gy,” Ships and Offshore Structures, vol. 15, no. 3, pp. 249-258, 2020.
[https://doi.org/10.1080/17445302.2019.1612544]

- K. K. Lee, “Development of FPGA based HIL simulator for PMS performance verification of natural liquefied gas carriers,” The Korea Institute of Information and Communication Engineering, vol. 22, no.7, pp. 949-955, 2018.
-
A. M. Elsherbiny, A. S. Nada, and M. Kamal, “Smooth transition from grid to standalone solar diesel mode hybrid generation system with a battery,” International Journal of Power Electronics and Drive System, vol. 10, no. 4, pp. 2065-2075, 2019.
[https://doi.org/10.11591/ijpeds.v10.i4.pp2065-2075]

- S. D. Kim and N. H. Kim, “A study on modeling of generator for HILS test of DC grid electric propulsion ship,” Conference of the Korea Institute of Information and Communication Engineering, Busan: Korea, pp. 110-112, 2020.
- A. T. Karlsen, On Modeling of a Ship Propulsion System for Control Purpose, Master Thesis, Norwegian University of Science and Technology, Trondheim, Norwegian, 2012.
- S. D. Kim and N. H. Kim, “A study on HILS test modeling and simulation for telegraph controller verification,” The Korea Institute of Information and Communication Engineering, vol. 25, no. 11, pp. 1612-1618, Nov. 2021.


