A study on load monitoring algorithms for EMS of hybrid electric propulsion ship
Copyright © The Korean Society of Marine Engineering
This is an Open Access article distributed under the terms of the Creative Commons Attribution Non-Commercial License (http://creativecommons.org/licenses/by-nc/3.0), which permits unrestricted non-commercial use, distribution, and reproduction in any medium, provided the original work is properly cited.
Abstract
To reduce the fuel consumption of electric propulsion ships equipped with various power sources, it is necessary to distribute the required load of the ship in a manner that aligns with the fuel consumption characteristics of each power source. This was achieved by optimizing the fuel consumption equation for the operation of each power source. As the number of power sources onboard increases, the time required for the optimization algorithms to complete their calculations also increases, potentially leading to difficulties in real-time control. In this study, a probability band algorithm is proposed for analyzing the power load demand of electric propulsion ships. The proposed method employs a historical analysis of the electric load demand to derive a representative value. As this representative value changes, the method determines the necessity for load-distribution optimization. To ascertain the efficacy of the probability band algorithm, a virtual ship comprising three distinct power generation sources is constructed and simulated with the propulsion and power loads derived from the ship, thereby ensuring the integrity of the results.
Keywords:
Optimization, Fuel consumption, Electric propulsion ship, Probability band algorithm, Real-time1. Introduction
Due to problems such as global warming, regulations on carbon emissions are becoming stricter worldwide. Shipping accounts for 90% of total freight volume. Consequently, a large amount of fuel is consumed, and regulations on ship carbon emissions are tightening. In response to regulations, considerable research is being conducted on electric propulsion ships and energy consumption reduction using variable frequency driver, scrubbers, and hybrid propulsion ships. Electrical propulsion ships generate power from a variety of power systems in response to the propulsion and electric loads used by the ship. Depending on the power system, the reliability and efficiency are inversely proportional. Prior to stricter regulations on carbon emissions, ship power system capacities were designed with an emphasis on reliability rather than efficiency. Currently, research is being conducted to optimize the capacity of power sources to increase their efficiency.
The load of an electric propulsion vessel can be classified into four categories: propulsion, continuous, intermittent, and heavy loads. The term "propulsion load" is used to describe the power consumed by the propulsion motors of the vessel. This represents the most significant proportion of power consumption during vessel operation. Moreover, the alteration in the vessel resistance resulting from meteorological fluctuations during operation is exclusively attributable to variations in the propulsion load. Continuous loads refer to the power consumed by mechanical systems such as pumps, which are continuously operated, as is the case with those used in ships. These systems operate continuously to ensure the stability of the ship and account for a lower percentage than the propulsion load but a higher percentage than the intermittent load. Continuous loads exhibit minimal variability because of their consistent utilization. Intermittent loads are repeatedly initiated and terminated to maintain the operational integrity of ship systems. Examples of such equipment include thrusters, auxiliary blowers, air compressors, air handling units, reference machines, and winches. These constitute the lowest percentage of the electric load on the ship. These loads consume a considerable amount of power during the initial start-up phase due to the high demand for start-up power. Therefore, a backup power source is essential to ensure a stable and reliable power supply. Medium loads necessitate supplementary maneuvering of the power source during operation. These include bow thrusters and cargo pumps, which require significant power but are not utilized under typical sailing conditions. Instead, they are used during berthing or post-berthing operations. These loads are operational for only a brief duration.
The capacity of the load and power system of the vessel is determined in the design step. Currently, the most prevalent power systems are diesel and dual-fuel engines, which drive alternators. Engine utilization is associated with high load rates, which are indicative of enhanced efficiency. However, preparation for load alterations is challenging due to the diminished availability of margin power. To improve the efficiency of an engine while bolstering its reliability, it is essential to ascertain whether its marginal power can withstand the present load fluctuations. In electric propulsion vessels, it is particularly challenging to guarantee the stability of the power system because the propulsion load falls within the power load category, and the resistance of the ship undergoes significant fluctuations and accounts for the highest proportion of power consumption.
The efficiency of electric loads can be optimized by modifying the load factor of the power system. In this instance, it is feasible to commence and terminate the same type of power system on a vessel with a single power system, given the absence of alternative sources. This is referred to as the light-load algorithm for the power management system (PMS) of the ship. In a power system comprising two or more power systems, the fuel-consumption characteristics of each system differ. Consequently, load sharing can enhance fuel consumption efficiency. The energy management system (EMS) is capable of deriving a fuel consumption model for each power system based on the operational characteristics of the power source under consideration and evaluating the efficiency of the model. Given the inherent fluctuations in power consumption in electric propulsion ships, mainly due to propulsion and intermittent loads, it is imperative to identify the optimal point within the continuous fuel consumption model. This approach enabled the optimization of fuel consumption through load sharing. Identifying the optimal point of the fuel consumption model under continuous load fluctuations requires considerable computing resources, and load sharing with a delayed response cannot accurately determine the optimal point for fuel consumption. To address this issue, this study proposes the probability band algorithm (PBA).
The PBA is a proposed program for monitoring the power consumption of a vessel with the objective of utilizing the changing electric load consumption in fuel consumption models. The term "intermittent load" is used to describe the phenomenon of power consumption that occurs in a regular pattern when systems are operated by starting and stopping appliances. The propulsion load is subject to variations as a result of the resistance experienced by the ship, which is, in turn, determined by a number of factors, including the speed of the ship and the sea state. The speed of the vessel depends on the revolutions per minute (RPM) of the propulsion motor and the state of the sea, which in turn determines the propulsion load. Given that the sea state does not change rapidly but remains constant over a period of time, it can be posited that the propulsion load will also move within a specific range, akin to an intermittent load. Consequently, the load on an electric propulsion vessel exhibits a certain degree of variability. However, the range of loads utilized determines the frequency, which can be expressed as a probability. The PBA can be employed in the fuel consumption model of hybrid electric propulsion ships to ascertain the range of loads utilized by electric propulsion ships and express it as a probability, thereby obtaining the fuel consumption. In conclusion, despite fluctuations in power consumption, the fuel consumption model remained unaffected by alterations in the PBA range, thereby ensuring its suitability for real-time applications.
In this study, the application of the proposed PBA to actual ship power‒load data is demonstrated, thereby illustrating its potential for use in fuel consumption models. The proposed PBA is expected to be applicable to EMS and will be developed in the future with the objective of reducing the consumption of computing resources.
2. Probability Band Algorithm
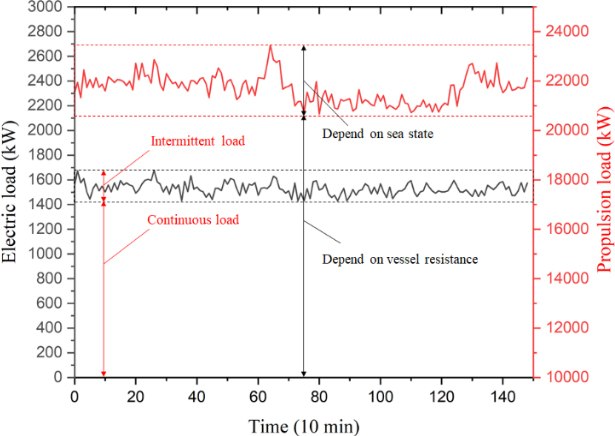
Figure 1 shows the behavior of the power and propulsion loads when a container ship is operating in sailing mode. As illustrated in Figure 1, the vessel resistance, which is contingent on the sea state, exhibits fluctuations within a defined magnitude, which in turn gives rise to a corresponding variation in the propulsion load. The red box represents the variation in propulsion load. The lowest point in the red box represents the minimum propulsion load, which depends on the speed of the vessel. The width of the box illustrates the variation in the propulsion load with respect to the sea state. Furthermore, it can be observed that the power load also exhibits fluctuations within a defined range. The constant range represents the intermittent load, which varies according to the utilization of the loads that commence and terminate to stabilize the engine system. The minimum starting point for these consumed electric loads is determined by the size of the continuous load, which represents the sum of the power loads required by the loads used continuously rather than the number of starts and stops on the ship. The requisite electric load of an electric propulsion ship is the sum of the propulsion and power loads and thus fluctuates within the confines of the two aforementioned boxes. The observation that the electric load demand is consumed within a defined range allows the use of past electric load demand data to inform future electric load consumption projections. The variability of the demand of a ship load is converted into a range of variations and a single electric load using a PBA.
In the absence of a PBA, the EMS employs a real-time load distribution algorithm to align the electric load with the demand. The load distribution must consider the reliability of each power system, with the objective of minimizing fuel consumption. The objective function of the load distribution algorithm is an expression that derives fuel consumption based on the output of the operating power systems. Grid search algorithms, genetic algorithms, and particle swarm optimization were employed to identify the output of each power system that minimized the objective function. One disadvantage of these algorithms is that the optimization of the objective function is a time-consuming process. Consequently, these algorithms are not well-suited for EMSs that require real-time responsiveness to power loads. To address this issue, a time delay can be employed to reduce the time required to compute the optimization algorithm. The PBA can be employed to derive a range of electric load requirements, which can then be subdivided to ascertain the probability that each bin is required. By combining this with the output of the objective function, the expected value of the output of the load distribution algorithm under the current demand load range can be ascertained. This implies that the optimization algorithm does not require recomputation if the power‒load range remains constant.
The PBA must determine the number of bins required to accommodate the electric load demand and the length of time that it wishes to observe in the past. An increase in the number of range divisions may enhance the precision of the PBA output when combined with the objective function. However, this approach may also increase the number of required computations. As the observation period lengthens, the variability of the box diminishes, necessitating greater spare power for power system control and, consequently, enhanced generation stability. However, when the required power fluctuates due to changes in the sea state and engine system, the change in the box is delayed, making it impossible to operate the power system efficiently. Accordingly, appropriate size and length should be selected based on the characteristics of the target vessel.
The PBA is comprised of five distinct steps.
- 1) The electric load is stored in a stack. In this step, the electric load demand for analysis is stored in a stack. The length of the stack to be stored is contingent on the size of the preceding segment to be observed.
- 2) A separator is created for each stack. In this step, a section was designated to separate the data within the stack. The number of division points was equal to the number of desired range divisions. As the number of range divisions increases, the resulting representative value becomes more accurate.
- 3) The electric load of the stack should be classified according to division points. In this step, a histogram is created. Subsequently, each data point was categorized and counted.
- 4) The probability of each bin is calculated. The number of data points corresponding to a given bin is divided by the total number of data points to obtain the proportion of data within that bin.
- 5) Determine the representative value. The representative value is obtained by multiplying the median value of each bin by the probability and adding them together.
If each step is represented in a pseudocode, it can be represented by Table 1.
The probability of operation of each section can be expressed as a function of the power operation range derived from the operation of the PBA, as shown in Equation (1).
| (1) |
where A(t,t+1) is the probability of operating in interval t and t+1, W is the size of the power operation range [kW], k is the length of the power operation storage data array stored by the PBA, and X is the power operation storage data stored by the PBA.
As indicated in Equation (2), the operational probability and median value of each PBA section can be determined and subsequently added to obtain a representative value.
| (2) |
Where R is a representative value [kW] of the current demand electric load range and Y(t) is the median value [kW] at t intervals.
By contrast, the fuel consumption of each power source in operation prior to the implementation of the PBA is given by Equation (3).
| (3) |
where, L is the required power load of the ship [kW], Pa is the power output of the dual fuel generator [kW], Pb is the power output of the fuel cell inverter [kW], Ba(x) is the fuel consumption of the dual fuel generator [g/h] when the power output of the dual fuel generator is x [kW], and Bb(x) is the fuel consumption of the fuel cell [g/h] when the power output of the fuel cell inverter is x [kW]. Pa was calculated as the difference between L and Pb.
By applying the results of the PBA, as expressed by Equations (1) and (3), the fuel consumption of the generating source with the PBA can be obtained, as shown in Equation (4). Thus, it can be concluded that the PBA should be capable of representing fluctuations in the current electric load demand, and the optimization result of Equation (4) can be employed in the implementation of the load distribution algorithm.
| (4) |
where, is the consumption [g/h] of the generator and fuel cell when the fuel cell inverter outputs x [kW], considering the results of the PBA.
The optimization algorithm, with Equation (4) as the objective function, yields a load-sharing configuration that minimizes fuel consumption. The optimization is valid when the PBA can accurately represent the current electric load demand variations. This indicates that it is still necessary to ascertain whether the vessel demand power requirement falls within the range of the result produced by the PBA from the previous optimization algorithm. If this is not the case, an optimization algorithm is executed to derive new load-sharing results. If the algorithm mentioned above is not executed correctly, the reduction in fuel consumption resulting from the optimization algorithm will be inaccurate, thereby rendering it challenging to achieve the maximum possible energy savings. In this study, the margin of the representative value is examined to ascertain whether it differed from the current representative value, thereby ensuring that the PBA is an accurate reflection of the required electric load. If the margin is inadequate, the result will be a considerable expenditure of computing resources because of the necessity of frequent computations. Conversely, if the margin is excessive, fewer computations are required, resulting in suboptimal load balancing and reduced fuel consumption. Equation (5) shows the correlation between the representative value of the PBA that most recently executed the optimization algorithm, the margin, and the present demand power load. Equation (5) can be employed to ascertain whether an optimization algorithm is required. If f(R, Rb) is T, it can be concluded that the current PBA operation results are identical to those of the previous optimization algorithm.
| (5) |
where Rb is a proxy for the power operating range [kW] at the time of the previous optimization algorithm, and γ is the margin [%/100].
The performance of the PBA is demonstrated through a minimal number of operations and substantial fuel savings. The performance metric can be created by dividing the difference between the fuel consumption by the optimal load sharing performed by all loads at the same demand load and using the same generation source before applying the PBA and the fuel consumption after applying the PBA by the number of operations. The number of operations is influenced by two key factors: the number of zones and the margin of the PBA. The product of the two variables represents the total number of operations.
3. Energy Management System
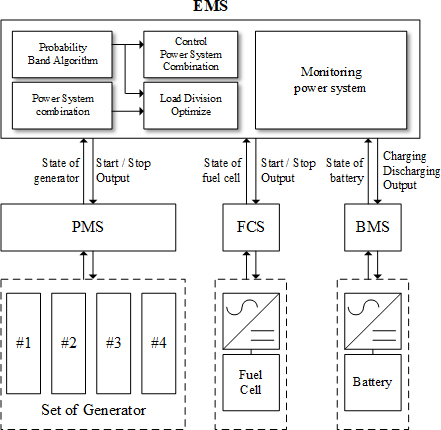
In a power system, the primary objective is to ensure the reliability of the power supply, followed by efficiency optimization. In a system in which a single power system is utilized to provide power, the power control system performs its designated functions. A case in point is a PMS. In a hybrid power system, it is challenging for a single power source to satisfy the requirements of the control system. An integrated system can be organized and linked to a single power source to fulfill its functions. Each system monitors the status of each power source and the load and issues commands derived from the internal algorithms. The figure above illustrates the interrelationship between the control system of the power system and the EMS.
The EMS is responsible for integrating, monitoring, and controlling each power source and load control system, as well as delivering power system information to users. To control each power source control system in an EMS, it is necessary to determine the combination of power sources, forecast the power load, and distribute the load. The power source combination determination algorithm simultaneously considers the stability and efficiency of the power supply. The use of a combination of generating sources with capacities smaller than the current load range reduces the reliability of the power supply. Conversely, an increase in the load factor of each source leads to an enhancement in the power supply efficiency. Conversely, the operation of superfluous sources and their combination at capacities exceeding the current load results in a reduction in load factors, thereby enhancing reliability but impairing efficiency. The application of power‒load forecasting algorithms to generation source control enhances reliability. The control of generation sources requires a certain amount of time, the absence of which compromises the reliability of the power supply. If the anticipated power consumption is considered and sufficient reserves are available, the reliability of the power supply is enhanced. Load-balancing algorithms were employed to improve the overall fuel consumption efficiency of the generation system. Given the disparate fuel consumption characteristics of various sources, it is incumbent upon the system to distribute the current power consumption in a manner that optimizes efficiency. The load-sharing algorithm employs a fuel consumption model based on the combination and output of the generation sources. The optimization results of this model were employed to control each power-source control system.
In a hybrid power system, there is a notable variation in power consumption. To maintain optimal load sharing, the algorithm must be capable of computing in accordance with the fluctuating power consumption. If the requisite computational results can be derived expeditiously, the available computing resources can be employed to respond in real time. In the process of identifying the optimal value of the fuel consumption model through grid search optimization, the computational burden may increase if there are more than three inputs or if the input unit is relatively small. This can impede their ability to respond in real time. To address this issue, one may utilize an optimization algorithm or reduce the number of optimization operations required. Although optimization algorithms are more time-efficient than grid search algorithms, they do not compute the entire solution space, which can result in local optimization. Optimizing and controlling a fuel consumption model that responds to instantaneous power consumption values and current power source operating conditions is challenging. This study proposes that the PBA represents a potential solution to this problem. The PBA identifies the current usage range of the load and applies this information to the fuel consumption model. The applied model was optimized and control commands for load sharing were sent to each power source control system. In this scenario, identical optimization outcomes may be replicated if the load utilization range remains unaltered. The outcome was a fuel consumption model applicable to a diverse range of loads as opposed to instantaneous loads.
3.1 Specification of target vessel
A virtual-vessel power system was constructed to ascertain the efficacy of the proposed PBA. The specifications of the virtual vessel power system were based on those of the target vessel as derived from the measured data. The specifications of the target vessel are presented in Table 2.
The target vessel is mechanically propelled, and the capacity of the main engine and power load must be covered with spare capacity by a power source capable of generating power continuously. Therefore, it is necessary to exclude the capacity of energy storage devices such as batteries. The spare capacity is defined as 8‒20% of the power source capacity. Consequently, the power generation system must be configured to satisfy Equation (6).
| (6) |
where is the capacity of generator i [kW], bc is the capacity of the fuel cell [kW], PLmax is the maximum value of the propulsion load [kW], ELmax is the maximum value of the electric load [kW], and n is the number of generators.
The specifications of the power system of the virtual ship that satisfies Equation (6) are configured as shown in Table 3.
3.2 Modeling a Dual Fuel Generator
A virtual vessel was designed to consume liquefied natural gas (LNG) to drive the prime mover and generate electric power by rotating an alternator. The dual-fuel generator employs pilot oil to facilitate the ignition of the primary fuel, LNG. The fuel consumption per unit power output of the pilot oil and LNG are illustrated in Equations (7) and (8), respectively.
| (7) |
| (8) |
where is the gas consumption [g/h] per output when the dual-fuel generator is operating at a load factor of x [%], and is the pilot oil consumption [g/h] per output when the dual-fuel generator is operating at a load factor of x [%].
3.3 Modeling a Fuel Cell
The fuel cell in the virtual vessel is a hybrid SOFC (Solid Oxide Fuel Cell). A hybrid SOFC is a fuel cell that uses unreacted gas and residual heat to maximize efficiency. Equation 9 shows the gas consumption per unit output of the hybrid SOFC.
| (9) |
where Bb(x) is the gas consumption per output [g/h] when the SFOC hybrid system is operated at a load factor x [%].
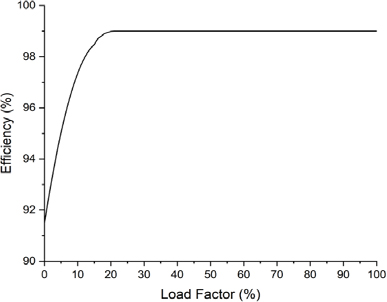
Because the output of a fuel cell is direct current, it is necessary to install an inverter that is capable of converting it to an alternating current. Figure 3 illustrates the efficiency of the inverter
3.4 Modeling a battery
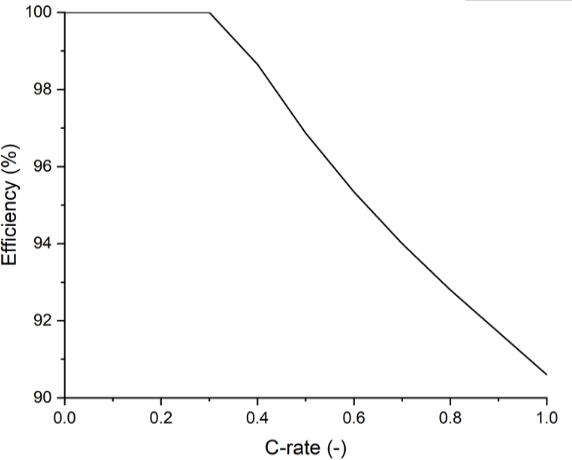
A lithium-based battery pack was used as the power source for the virtual ship. The efficiency of a battery is contingent on its output as it undergoes charging and discharging processes. As the output decreases, efficiency increases; conversely, as the output increases, efficiency decreases. Figure 4 illustrates the output of a battery with a capacity of 1,000 kWh, demonstrating the relationship between efficiency and output.
The output of a battery, like that of a fuel cell, is a direct current power source. Accordingly, an inverter is required for the purpose of connecting the aforementioned direct current power source to an alternating current bus. Given that the battery is required to be capable of both charging and discharging simultaneously, a bidirectional inverter is necessary. The efficiency of the inverter is identical to that of a fuel cell.
3.5 Fuel Consumption Expressions
The power source of the virtual vessel comprised a dual-fuel generator, fuel cells, and batteries. The power requirement of a ship is not an arbitrarily determined value; instead, it is a given value resulting from the operations of the ship. Once the outputs of two of the three power sources were established, the output of the remaining power source was determined. The fuel consumption equation is not entirely deterministic due to the inherent variability of the fuel cell and battery outputs, which are more stable when the generator output fluctuates.
The battery was subdivided into two distinct phases: charging and discharging. Consequently, the fuel consumption equation must be calculated to reflect this division. As the battery charge increases, so does the fuel consumption. However, the process of charging the battery results in an increase in fuel consumption, even though the stored power is not consumed. Therefore, it is necessary to exclude fuel consumption corresponding to the power used for charging from the fuel consumption formula. Equation (10) illustrates the fuel consumption associated with battery charging during dual fuel generator and fuel cell operation.
| (10) |
where is the demand electric load L [kW], battery inverter input power [kW] and fuel cell inverter output power Pb[kW], fuel consumption [g/h], is the power charged in the battery [kW], respectively. Pa can be obtained as the difference between the sum of the demand power load L [kW], the battery inverter input power [kW], and the fuel cell inverter output power Pb[kW].
Equation (10) illustrates the fuel consumption expression in the absence of PBA, which is expressed as Equation (11) when PBA is applied.
| (11) |
where is the fuel consumption [g/h] when the PBA is applied, is the bidirectional battery inverter input power [kW], and is the fuel cell inverter output power Pb [kW], X is the power operation storage data stored by the PBA..
The equation for fuel consumption was constructed by including fuel consumption at battery discharge, which was excluded from the equation for charging the battery. Equation (12) illustrates the fuel consumption associated with discharging the battery during the generator and fuel cell.
| (12) |
where is the fuel consumption [g/h], is the battery output power [kW], and Bbat is the fuel consumed per battery charge power [g/kWh], and the demand power load L [kW], battery inverter output power [kW], and fuel cell inverter output power Pb[kW], respectively.
Similarly, Equation (12) illustrates the fuel consumption expression in the absence of PBA, which is expressed as Equation (13) when the PBA is applied.
| (13) |
where is the fuel consumption [g/h] when the PBA is applied, is the battery bidirectional inverter output power [kW], and is the fuel-cell inverter output power Pb [kW].
4. Simulation
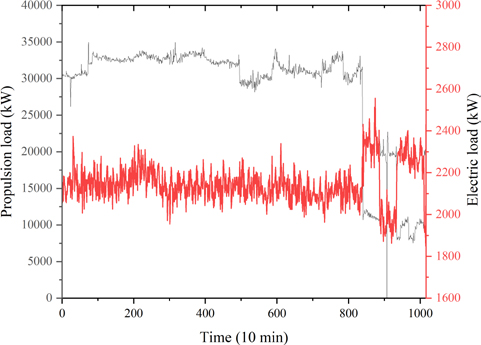
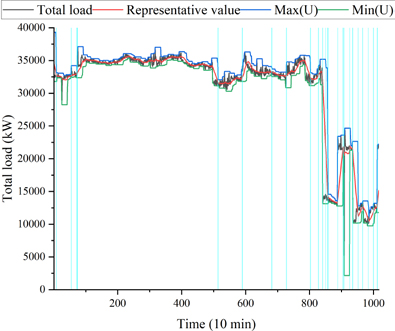
The objective of the simulation was to illustrate the efficacy of the PBA by contrasting the fuel consumption optimization outcomes prior to its implementation with those subsequent to its introduction. The simulation was conducted using approximately seven days of measured propulsion and power loads collected while the target vessel was operating in sailing mode. Figure 5 and Table 4 show the simulated load profiles.
As illustrated in Figure 4, a reduction in the propulsion load was observed at approximately 8,300 minutes, which appeared to increase the power load due to the operation of the main engine auxiliary blowers. At 8,900 minutes, an increase in the propulsion load was observed as a consequence of the speed increase. Conversely, a decrease in the power load was observed following the shutdown of the auxiliary blower. The power load fluctuates within the designated operational range following an alteration in the load.
The following assumptions were made in conducting the simulation:
- 1) It is not necessary to consider the time spent on optimization results.
- 2) The optimization algorithm employs a grid searching.
- 3) The optimal load distribution in the absence of PBA was determined based on the solutions to Equations (9) and (11).
- 4) The optimal load distribution with PBA is employed based on the outcomes of the resolution of Equations (10) and (12).
4.1 The absence of PBA
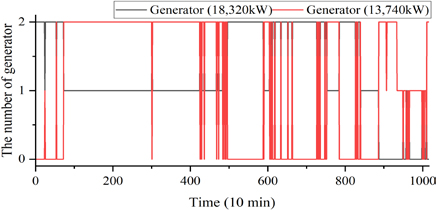
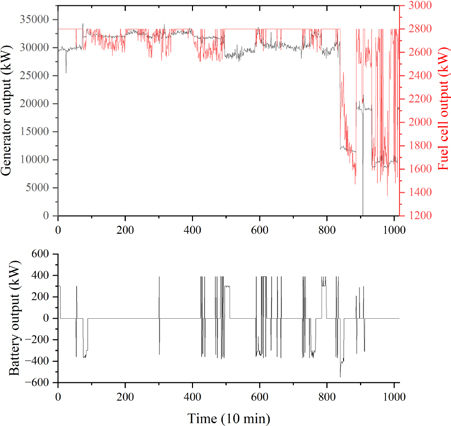
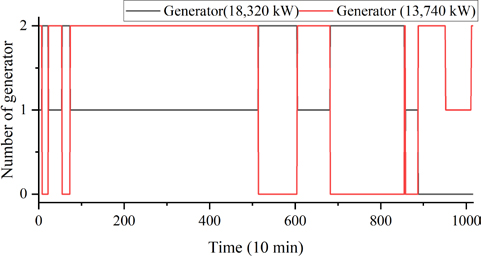
The power system was operated by optimizing a grid-searching algorithm for all loads, thereby ensuring high operational performance. However, the optimization algorithm is relatively time-consuming, which precludes its use in real time. When the load profile depicted in Figure 5 was optimized and operated without the application of the PBA, the following results were observed:
As a consequence of the optimization process being applied to all demand loads, the number of generators in operation and the output of the power source undergo rapid changes in response to load fluctuations. Although it has the potential to reduce fuel consumption, it is not a viable solution for real-time operation because of the extended optimization time, which exceeds the rate of change in the demand load.
4.2 With PBA
In the context of optimizing load distribution through the application of a PBA, the operational priority is the electric load demand. The parameter settings are of paramount importance for the implementation of the PBA, as listed in Table 5.
The operational results of the PBA are presented in Figures 9 and 10 and are listed in Table 5.
In Figure 9, the vertical line indicates the point at which the optimization algorithms were executed. A total of 25 optimization algorithms were required to address 1,016 demand loads.
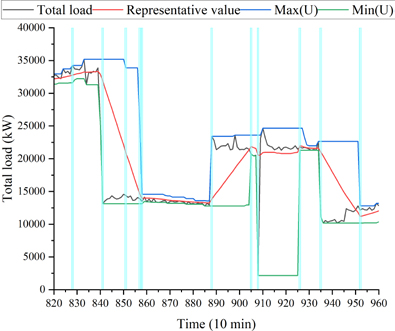
Figure 10 illustrates the outcomes of the PBA in the context of rapid fluctuations in demand loads. The representative value is typically followed, although it may require a period of adjustment when there are sudden load fluctuations. That is, when the electric load demand decreases rapidly, the maximum value of X is high, resulting in excessive spare power and a reduction in efficiency. Conversely, when the demand load quickly increased, the representative value did not align with the actual load usage range. This discrepancy results in the outcomes of the optimization algorithm differing from the operating power range, which ultimately impairs the efficacy of the load-balancing algorithm.
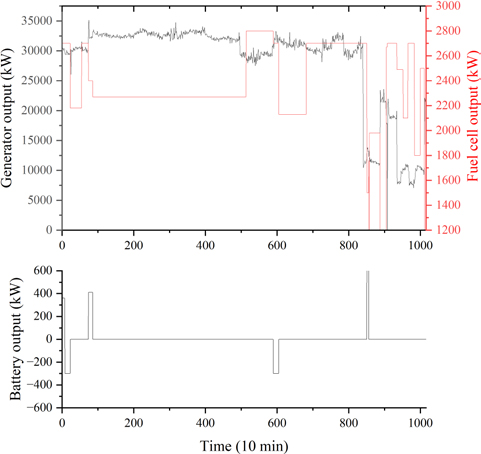
Following the implementation of the PBA, the load distribution optimization algorithm was reduced to 25 times. Consequently, the operation of power generation sources is streamlined compared to the state that precedes the application of the PBA. It should be noted that among the power generation sources, the dual-fuel generator is subject to the most significant change in output because its output is determined according to changes in the required power load. In contrast, the outputs of the fuel cells and batteries underwent less significant alterations. The reduction in the number of opportunities for the optimization algorithm to operate results in a lower frequency of battery utilization despite the potential for its operation.
4.3 Analysis performance of PBA
The objective of the PBA is to reduce the number of operations required to achieve the desired fuel consumption. Table 6 presents the operating results before and after the implementation of the PBA, utilizing an identical power–load profile.
In the absence of the PBA, the number of optimized runs was 1,016, which corresponded to the length of the operating profile. Conversely, the application of PBA allowed for a reduction in the number of optimized runs to 25 times.
In the absence of a PBA, the optimization of all-electric load requirements allows for the observation of the optimal fuel consumption when operating with a given power source. Accordingly, the optimized fuel consumption for this power load profile was 819.8365 tons. When the PBA was employed, the fuel consumption was 824.6685 tons. This represents an increase of approximately five tons in fuel consumption; however, it is a more practical solution.
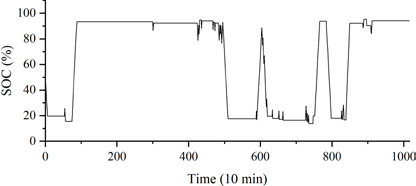
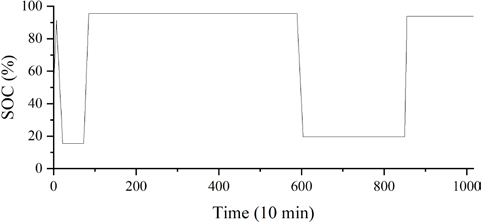
The state of charge (SOC) of the battery did not affect the analysis of the simulation results, as the simulation concluded at approximately 94% in both scenarios.
Prior to the implementation of the PBA, the battery was utilized at a greater frequency than it was after its application. This reduces the overall health or SOH (State Of Health) of the battery. The objective of a battery management algorithm is to optimize the efficiency of the battery while minimizing its operational workload.
5. Conclusion
The implementation of load-balancing algorithms is crucial for enhancing the fuel-consumption efficiency of an EMS. Load-balancing algorithms determine the output of each power source by optimizing the fuel consumption formula according to the output of each power source. Despite the implementation of optimization algorithms, it remains challenging to respond effectively to real-time fluctuations in power demand. This study employs the PBA to address the issue mentioned above. The PBA transformed the operational pattern of the demand load into a singular representative value. As the representative value changed, an investigation was conducted to ascertain whether the deployment of an optimization algorithm would prove beneficial. Moreover, an equation was formulated to optimize the fuel consumption based on the historical operational pattern of the demand power load.
To validate the efficacy of this study, the propulsion and power loads of a 13,000 TEU container ship were meticulously documented in the sailing mode at 10-minute intervals for approximately seven days. Because the data were obtained from a mechanically propelled vessel, they were converted and applied to an electrically powered vessel. Utilizing the specifications of the target ship, a power generation system is employed for a virtual ship, and an electric-powered vessel, and fuel consumption equations are derived for each operational scenario. The consumption equations were then simulated using the propulsion and power‒load profiles.
The number of computations in the optimization algorithm was exponentially reduced with the PBA, reaching approximately 2.5%. Concurrently, the fuel consumption increased by 0.684 tons per day. The utilization of batteries is reduced by approximately 50%, which consequently permits the extension of battery lifespan. The increase in fuel consumption was trivial compared to the daily consumption, resulting in a reduction in the number of operations. This indicates that the PBA can be employed in the load distribution optimization algorithm of the EMS to assist with real-time control.
Acknowledgments
This research was financially supported by the Ministry of Trade, Industry and fuel, Korea, under the “Regional Innovation Cluster Development Program(R&D)(P0025328)” supervised by the Korea Institute for Advancement of Technology(KIAT).
Author Contributions
Conceptualization, J.H. Lee and J.S Oh; Methodology, J.H. Lee; Software, J.H. Lee; Validation, J.H. Lee J.S Oh; Formal Analysis, J.H. Lee; Investigation, J.H. Lee; Resources, J.H. Lee; Data Curation, J.H. Lee; Writing—Original Draft Preparation, J.H. Lee; Writing—Review & Editing, J.S Oh; Visualization, J.H. Lee; Supervision, J.S Oh; Project Administration, J.S Oh; Funding Acquisition, J.S Oh.
References
-
A. Fan, Y. Li, H. Liu, L. Yang, Z. Tian, Y. Li, N. Vladimir, “Development trend and hotspot analysis of ship energy management,” Journal of Cleaner Production, vol. 389, 2023.
[https://doi.org/10.1016/j.jclepro.2023.135899]

-
M. Kalikatzarakis, R. D. Geertsma, E. J. Boonen, K. Visser, R. R. Negenborn, “Ship energy management for hybrid propulsion and power supply with shore charging,” Control Engineering Practice, vol. 76, pp. 133-154, 2018.
[https://doi.org/10.1016/j.conengprac.2018.04.009]

-
B. Wang, X. Peng, L. Zhang, and P. Su, “Real time power management strategy for an all-electric ship using a predictive control model,” vol. 16, no. 9, pp. 1808-1821, 2022.
[https://doi.org/10.1049/gtd2.12419]

-
R. Tang, X. Li, and J. Lai, “A novel optimal energy-management strategy for a maritime hybrid energy system based on large-scale global optimization,” Applied Energy, vol. 228, pp. 254-264, 2018.
[https://doi.org/10.1016/j.apenergy.2018.06.092]

-
N. Planakis, G. Papalambrou, and N. Kyrtatos, “Ship energy management system development and experimental evaluation utilizing marine loading cycles based on machine learning techniques,” Applied Energy, vol. 307, 2022.
[https://doi.org/10.1016/j.apenergy.2021.118085]

-
X. Guo, X. Lang, Y. Yuan, L. Tong, B. Shen, T. Long, W. Mao, “Energy management system for hybrid ship: Status and perspectives,” Ocean Engineering, vol. 310, no. 1, 2024.
[https://doi.org/10.1016/j.oceaneng.2024.118638]

-
C.-L. Su, W.-L. Chung, and K.-T. Yu, “An energy-savings evaluation method for variable-frequency-drive applications on ship central cooling systems,” in IEEE Transactions on Industry Applications, vol. 50, no. 2, pp. 1286-1294, 2014.
[https://doi.org/10.1109/TIA.2013.2271991]

-
S. V. Giannoutsos and S. N. Manias, “A systematic power-quality assessment and harmonic filter design methodology for variable-frequency drive application in marine vessels,” in IEEE Transactions on Industry Applications, vol. 51, no. 2, pp. 1909-1919, 2015.
[https://doi.org/10.1109/TIA.2014.2347453]

-
S. B. Dabadgaonkar, R. Prasad, and A. K. Sen, “Energy efficient green technology for eco-friendly shipping using adjustable frequency drive for seawater cooling systems,” Paper presented at the SNAME Maritime Convention, Bellevue, Washington, USA, November 2016.
[https://doi.org/10.5957/WMTC-2015-248]

-
T. A. Tran, “Research of the scrubber systems to clean marine diesel engine exhaust gases on ships,” Journal of Marine Science: Research & Development, vol. 7, no. 6, 2017.
[https://doi.org/10.4172/2155-9910.1000243]

-
Ç. Karatuğ, Y. Arslanoğlu, and C. G. Soares, “Feasibility analysis of the effects of scrubber installation on ships,” Journal of Marine Science and Engineering, vol. 10, no. 12, 2022.
[https://doi.org/10.3390/jmse10121838]

-
J. F. Hansen and F. Wendt, “History and state of the art in commercial electric ship propulsion, integrated power systems, and future trends,” in Proceedings of the IEEE, vol. 103, no. 12, pp. 2229-2242, 2015.
[https://doi.org/10.1109/JPROC.2015.2458990]

- H. P. Nguyen, A. T. Hoang, S. Nizetic, X. P. Nguyen, A. T. Le, C. N. Luong, V. D. Chu, and V. V. Pham, “The electric propulsion system as a green solution for management strategy of CO2 emission in ocean shipping: A comprehensive review,” International Transactions on Electrical Energy Systems, vol. 31, no. 11, 2020.
-
H. Lan, S. Wen, Y. -Y. Hong, D. C. Yu, and L. Zhang, “Optimal sizing of hybrid PV/diesel/battery in ship power system,” Applied Energy, vol. 158, pp. 26-34, 2015.
[https://doi.org/10.1016/j.apenergy.2015.08.031]

-
S. Wen, H. Lan, D. C. Yu, Q. Fu, Y. -Y. Hong, L. Yu, R. Yang, “Optimal sizing of hybrid energy storage sub-systems in PV/diesel ship power system using frequency analysis,” Energy, vol. 140, no. 1, pp. 198-208, 2017.
[https://doi.org/10.1016/j.energy.2017.08.065]

-
A. Dolatabadi and B. Mohammadi-Ivatloo, “Stochastic risk-constrained optimal sizing for hybrid power system of merchant marine vessels,” in IEEE Transactions on Industrial Informatics, vol. 14, no. 12, pp. 5509-5517, 2018.
[https://doi.org/10.1109/TII.2018.2824811]

-
Divyajot, R. Kumar, and M. Fozdar, “Optimal sizing of hybrid ship power system using variants of particle swarm optimization,” 2017 Recent Developments in Control, Automation & Power Engineering (RDCAPE), Noida, India, pp. 527-532, 2017.
[https://doi.org/10.1109/RDCAPE.2017.8358327]

-
X. Feng, K. L. Butler-Purry, and T. Zourntos, “Real-time electric load management for DC zonal all-electric ship power systems,” Electric Power Systems Research, vol. 154, pp. 503-514, 2018.
[https://doi.org/10.1016/j.epsr.2017.09.014]

-
H.-M. Chin, C.-L. Su, and C.-H. Liao, “Estimating power pump loads and sizing generators for ship electrical load analysis,” in IEEE Transactions on Industry Applications, vol. 52, no. 6, pp. 4619-4627, 2016.
[https://doi.org/10.1109/TIA.2016.2600653]

-
O. Yuksel, “A comprehensive feasibility analysis of dual-fuel engines and solid oxide fuel cells on a tanker ship considering environmental, economic, and regulation aspects,” Sustainable Production and Consumption, vol. 42, pp. 106-124, 2023.
[https://doi.org/10.1016/j.spc.2023.09.012]

-
K. Belibassakis, S. Bleuanus, J. Vermeiden, and N. Townsend, “Combined performance of innovative biomimetic ship propulsion system in waves with dual fuel ship engine and application to short-sea shipping,” Paper presented at the The 31st International Ocean and Polar Engineering Conference, Rhodes, Greece, 2021.
[https://doi.org/10.1201/9781003320272-33]

-
V. C. Pham, B.-S. Rho, J.-S. Kim, W.-J. Lee, and J.-H. Choi, “Effects of various fuels on combustion and emission characteristics of a four-stroke dual-fuel marine engine,” Journal of Marine Science and Engineering, vol. 9, no. 10, 1072, 2021.
[https://doi.org/10.3390/jmse9101072]


