Performance analysis of a constant-speed LPG engine
Copyright © The Korean Society of Marine Engineering
This is an Open Access article distributed under the terms of the Creative Commons Attribution Non-Commercial License (http://creativecommons.org/licenses/by-nc/3.0), which permits unrestricted non-commercial use, distribution, and reproduction in any medium, provided the original work is properly cited.
Abstract
Modern society faces the difficult task of solving environmental issues to achieve sustainable economic growth and meet increasing energy demands. The operation of ships consumes large amounts of fuel and emits harmful gases, significantly contributing to air pollution and climate change. In accordance with the strengthening international environmental regulations, this study focuses on LPG fuel as an eco-friendly alternative with potential for achieving low CO₂ and NOx emissions and operational-cost efficiency. The performance of a developed 200-kW class LPG engine under various load scenarios was experimentally evaluated and its performance was verified by comparison with the diesel engine of an 8000-ton class training ship emergency generator. Based on the experimental results, this engine exhibited low NOx emissions commensurate with the International Maritime Organization (IMO) Tier III regulations, and showed relatively low CO emissions and fuel consumption compared to diesel engines. The engine was found to have economic and environmental advantages over conventional diesel engines, and its potential as a marine engine was confirmed based on its performance according to the load. These findings are expected to provide a basis for future research and development of alternative fuels and serve as an experimental benchmark for various types of vessels equipped with LPG engines.
Keywords:
LPG engine, Specific fuel oil consumption, Carbon dioxide, Nitrogen dioxide, Engine performance1. Introduction
Modern society faces the challenge of resolving environmental issues in line with sustainable economic growth and increasing energy demands. Ships consume a large amount of fuel because of their large scale and long operating hours, and emit a considerable amount of harmful gases in the process [1]. Consequently, they have been identified as one of the main causes of air pollution and climate change, which has led to the strengthening of environmental regulations in the maritime sector. In line with this, regulations are becoming increasingly stringent, and at the 80th International Maritime Organization (IMO) Marine Environment Protection Committee (MEPC) on July 7, 2023, the “2023 Greenhouse Gas Reduction Strategy” was adopted, declaring net-zero emissions for international shipping by 2050 [2].
With the strengthening of environmental regulations, shipping companies and shipyards are striving to develop new eco-friendly ships that meet these standards. This serves as an important catalyst for accelerating the transition to ecofriendly energy in the maritime sector, drawing attention to the use of ecofriendly alternative fuels such as hydrogen, ammonia, liquefied natural gas (LNG), methanol, and liquefied petroleum gas (LPG) [3][4].
Among these fuels, LPG is considered a realistic alternative that can play a bridging role in transitioning to future eco-friendly fuels, such as hydrogen and electricity. LPG, with lower CO₂ and NOx emissions than conventional ship fuels and virtually no sulfur oxide or particulate matter emissions, is being evaluated as the most suitable fuel for meeting international ship emission regulations. Moreover, compared with LNG or compressed natural gas (CNG), LPG has a higher calorific value, making it superior in terms of operational economy. The cost of setting up bunkering infrastructure is also lower than that of LNG, enabling a stable energy supply. However, most research on developing LPG engines conducted thus far has focused on large ships, and there is a lack of substantial research on the development of LPG engines suitable for small- and medium-sized ships. Furthermore, most existing LPG engines have been developed for land use, such as in vehicles or for power generation. Directly applying these engines to ships poses several problems that must be addressed. Therefore, the implementation of an eco-friendly and economical LPG engine in ships is an urgent requirement for shipping companies, both domestically and internationally. Against this backdrop, this report presents a performance analysis of LPG engines for small- and medium-sized ships, aiming to provide basic data for application to various types of ships. Furthermore, the results obtained in this study can be utilized for the research and development of alternative fuels [5].
2. Configuration of LPG Engine and Experimental Method
2.1 Configuration of LPG Engine
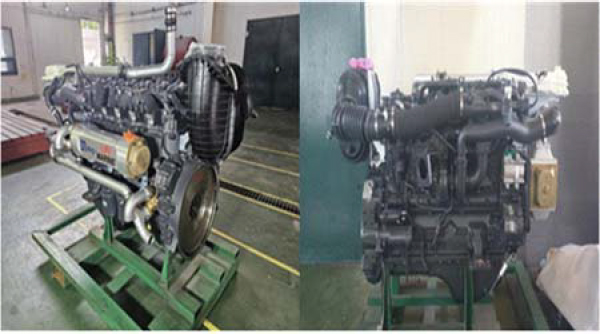
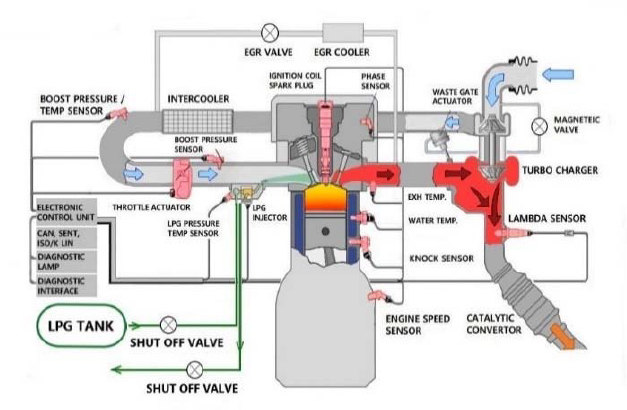
The propulsion system considered in this study consists of an electric propulsion system with two water-jet propulsion systems. A 200-kW class LPG engine was selected and developed as the prime mover for the generator of this system. The developed LPG engine, similar to the existing CNG engine, allows gaseous fuel to pass through the engine and generate output through combustion. However, unlike gaseous fuel, liquefied fuel is designed and manufactured as shown in Figure 1. Figure 2 shows a diagram of the fuel system.
As shown in Table 1, compared with the CNG engine, the output of the LPG engine is 230 kW, and a torque of 1.35 kN is supplied by the 6-cylinder engine, which operates via the Otto cycle and spark ignition method. The CNG engine uses the multi-point gas injection (MPGI) method, and the LPG engine uses the multi-point liquid injection (MPLI) method. The fuel supply system of the LPG engine was designed in a returnless format, maintaining a pressure of 2 MPa through the fuel pump to prevent a phase change in the fuel supplied to the engine within the fuel line. The fuel was individually supplied to each cylinder during the intake stroke by being sprayed as a liquid through an injector mounted on the intake manifold of each cylinder. After passing through the compression stroke in the combustion chamber, the supplied fuel was ignited by a spark-plug flame. The amount of fuel supplied to each cylinder was controlled using an engine control unit.
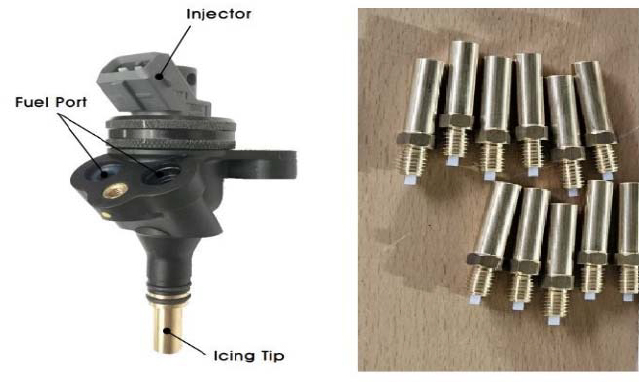
When liquid propane fuel is sprayed from the injector, due to the heat of vaporization, the fuel condenses with the surrounding moisture. This generates moisture that freezes and accumulates around the injector where the fuel is sprayed, leading to an icing phenomenon that interferes with fuel injection. To prevent icing, a plastic icing tube was installed from the injector spray hole inside the intake manifold (Figure 3) to prevent the vaporized fuel from directly touching the injector, and an icing tip was constructed to support the icing tube. In an engine with a LPG liquid injection system, fuel injection occurs according to the theoretical air-fuel ratio based on the amount of intake air, and ignition is carried out by a spark plug through an ignition coil that generates a high voltage [6].
Operating at the theoretical air-fuel ratio provides relatively high output characteristics under the same displacement conditions, and by applying a three-way catalytic converter as an after-treatment device for the exhaust gas, it is possible to satisfy the IMO Tier III exhaust gas regulations through the oxidation and reduction reactions of precious metals applied to the three-way catalytic converter without supplying a separate reducing agent, enabling economical operation [7].
2.2 Test System and Equipment
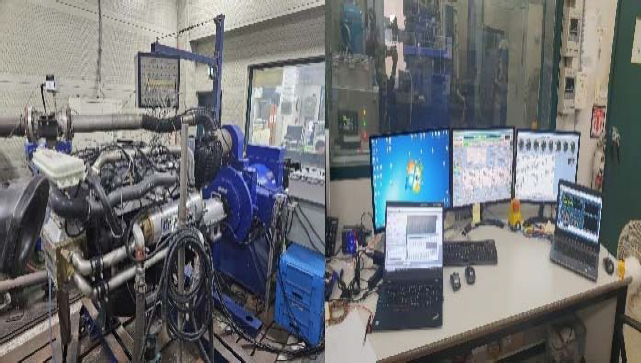
To verify and control the performance of the LPG engine, the automation system of the FEV, composed of an automation tower, a DAQ in a cell, and an automation program, as presented in Table 2, was installed in the control room. An AC dynamometer that adjusted the load using an alternating current motor and a water-cooling controller that controlled the coolant temperature were connected to the engine and installed on site. The amount of LPG fuel and air injected into the engine was measured using installed fuel flow meters from Emerson and airflow meters from Sierra. A combustion pressure sensor, combustion analyzer, and program from KISTLER were used to verify the combustion characteristics within the combustion chamber. Additionally, an exhaust gas analyzer (HORIBA) was used to analyze each component of the exhaust gas generated after combustion.
2.3 Experimental Scenario
The developed LPG engine was designed for application in small- and medium-sized ships and can potentially be applied in various types of vessels. The operating characteristics of each type of vessel are decisive factors affecting the engine performance. Accordingly, performance analysis was conducted using load scenarios that reflected various operating characteristics. Four A–D load scenarios were established to test the performance of the developed LPG engine. The load was varied using a dynamo, and the engine was operated for approximately 90 min, as shown in Figure 4.
Figure 5(a) represents the scenario where the load was increased from 0 kW to 10, 20, 30, and up to 200 kW in increments of 10 kW at 2 min intervals. Figure 5(b) demonstrates the scenario in which the load was changed by 50 kW (from 0 kW to 200 kW, and back to 0 kW) at 3 min intervals. Figure 5(c) depicts the scenario in which the load was shifted by 66 kW (from 0 kW to 200 kW, and back to 0 kW) at 2 min intervals. Figure 5(d) shows the scenario in which the engine was operated at 0 kW for 1 min, then at 200 kW for 3 min, and back to 0 kW for 1 min. To set up each scenario, the load changes were performed manually. The engine performance, fuel consumption, temperature, pressure, and exhaust gas data were measured at 1 s intervals. This experiment was used to evaluate the suitability of the LPG engine as a marine engine and to analyze the performance according to the engine load by measuring the fuel consumption and exhaust gas.
3. Results and Discussion
3.1 Result of NOx Analysis
The LPG engine used in this study adopts a liquid fuel injection method that leverages the latent heat of vaporization of the liquid LPG fuel to increase the volumetric efficiency and enhance the output of the engine.
In previous research, Nguyen and Nguyen [8] stated that by using an LPG liquid injection system, the output and fuel efficiency of the engine could be improved without unstable torque characteristics by accurately controlling the air-fuel ratio, while also reducing NOx emissions.
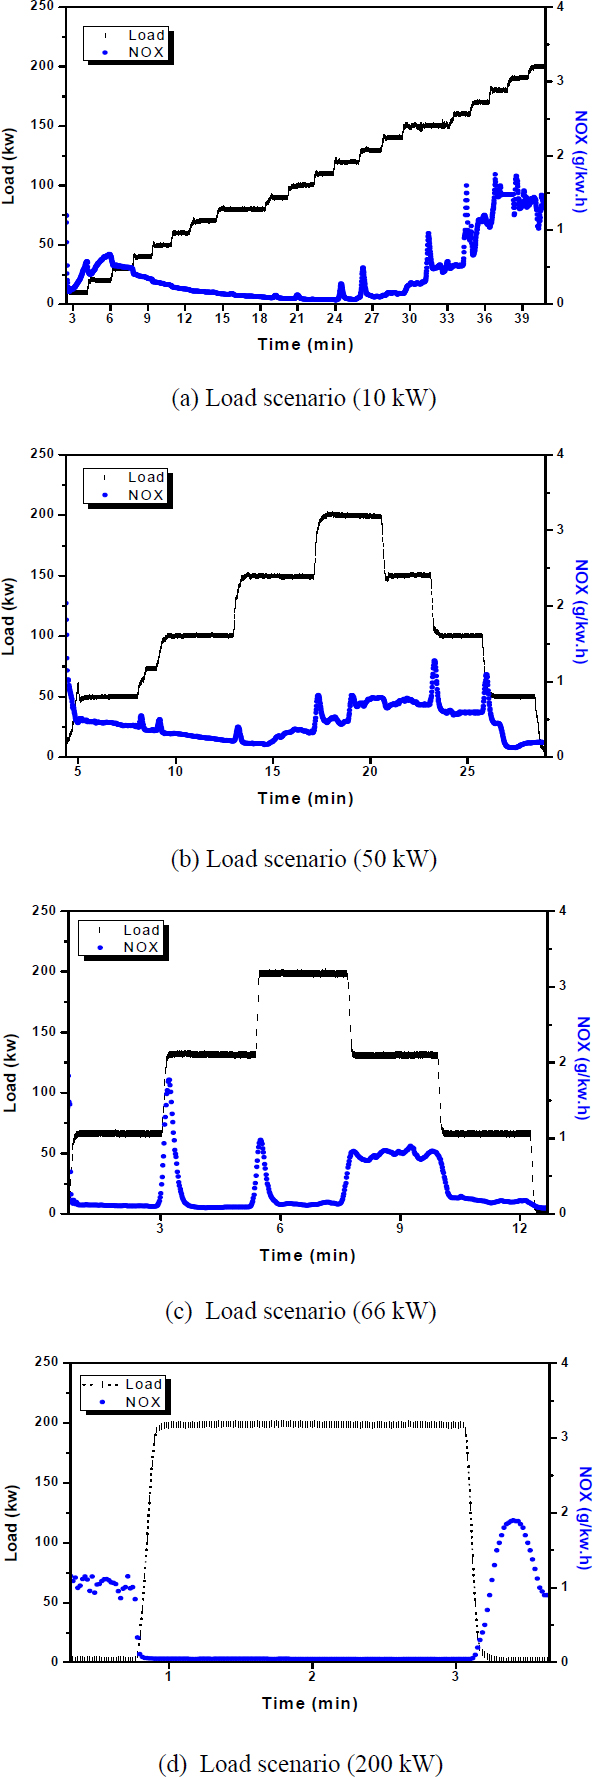
According to the formula in Table 3 provided by the IMO, the nitrogen oxide emission standard for an engine running at 1800rpm to meet the IMO Tier III requirements is 2 g/kWh. Figure 6 shows the NOx emissions of nitrogen oxides for each load scenario, and it can be confirmed that all are within the emission standard of 2 g/kWh [9].
As shown in Figure 6(a), when the load increased slowly, the emissions of nitrogen oxides initially increased and then gradually decrease, recording 0.06 g/kWh. However, in the section above 100 kW, there were fluctuations in the emissions according to the load changes, which peaked at 1.7 g/kWh. In scenarios where the load increased rapidly, as in Figure 6(b) and Figure 6(c), the fluctuations in nitrogen oxide emissions due to load changes became even larger.
Particularly, Figure 6(d) shows the largest fluctuation. Nitrogen oxide emissions tended to be high during the load-reduction sections for each scenario. This appears to be due to changes caused by air-fuel ratio imbalances during rapid load fluctuations, and it is presumed that this would have affected the rate of the three-way Catalytic Converter reaction because the theoretical air-fuel ratio operation was not sustained.
3.2 Results of SFOC Analysis
The specific fuel oil consumption (SFOC) is an indicator of the amount of fuel consumed over a specific period. This can vary depending on the operating environment and engine conditions.
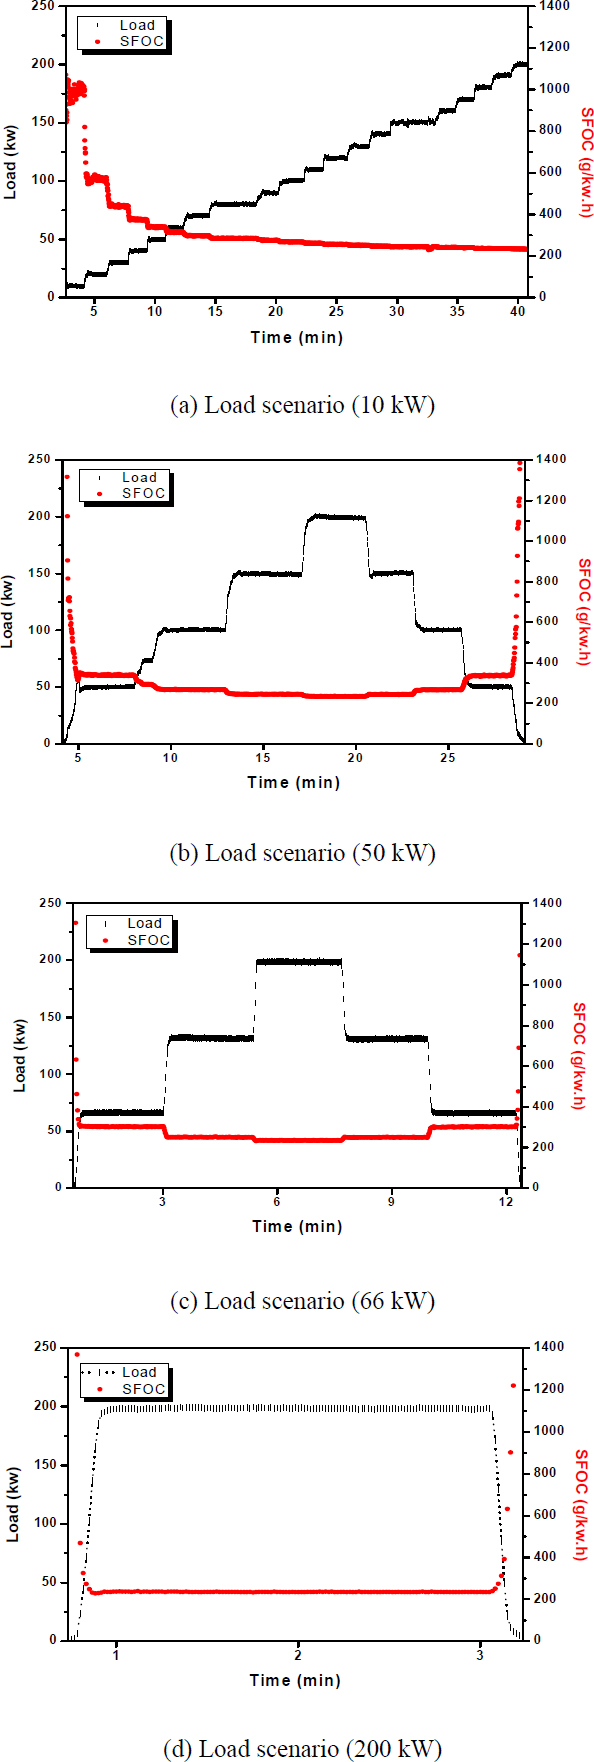
For these reasons, in this study, all external forces or environments that are possible while the engine is operating were excluded, and the experiment was conducted according to each scenario by purely changing the load itself. The change in the SFOC according to engine load is shown in Figure 7.
As shown in Figure 7(a), the initial SFOC at the start of the operation was 980 g/kWh and decreased sharply as the load increased. Notably, from a load of 50 kW, the SFOC decreased stably, and at the maximum load of 200 kW, the SFOC was 233.1 g/kWh.
Figure 7(b),(c) presents scenarios in which the load was increased sharply. In these respective cases, the SFOC decreased sharply to 340.6 and 339.4 g/kWh under a load of up to 50 kW.
Thereafter, the SFOC decreased stably and reached 233.4 and 234.4 g/kWh, respectively, at the maximum load of 200 kW. However, when the load decreased, the SFOC tended to increase sharply beyond the load of 50 kW.
The same tendency was observed in the scenario in Figure 7(d), where the change in the SFOC up to a load of 50 kW was particularly severe.
Based on the above experimental results, it can be confirmed that the results of prior research are satisfactory.
Zhang et al. [10] showed that the SFOC decreases significantly as the engine output increases, which is one of the characteristics of internal combustion engines, because the thermal efficiency of the engine cycle improves.
The present experiments confirmed that the SFOC of the LPG engine decreased continuously as the engine load increased, and the decrease was noticeable within certain load ranges. The SFOC exhibited a minimum value at a maximum load of 200 kW [11].
The SFOC, which represents the performance of an engine, has a direct impact on fuel-cost savings.
Because the SFOC is related to CO2 emissions, decreasing the SFOC through efficient engine operation can contribute significantly to reducing CO2 emissions.
3.3 Result of CO2 Emission Analysis
According to the IMO's policy to reduce carbon dioxide emissions to “net zero” by 2050, the emission of carbon dioxide, one of the greenhouse gases, has also become a crucial factor that must be considered from an environmental perspective.
In this context, this study aimed to verify the carbon dioxide emission levels of the developed LPG engine and measure and analyze the carbon dioxide emissions in each scenario.
Equation (1) was used to calculate the emission of carbon dioxide for each scenario [12].
| (1) |
The petroleum conversion factor is used to convert the calorific value of petroleum based on the calorific value of various energy sources.
Article 5 of the Energy Law Enforcement Rules presents the petroleum conversion factors (TOE: ton of equivalent) for each energy source; the petroleum conversion factor for LPG is 1.105 [13].
The carbon emission factor is defined based on the calorific value of each fuel, and is calculated as a secondary factor related to the petroleum conversion factor based on the calorific value ratio for 1 kg of crude oil. LPG, which is currently the fuel used in this engine, has a carbon emission factor of 0.713 according to the Intergovernmental Panel on Climate Change (IPCC).
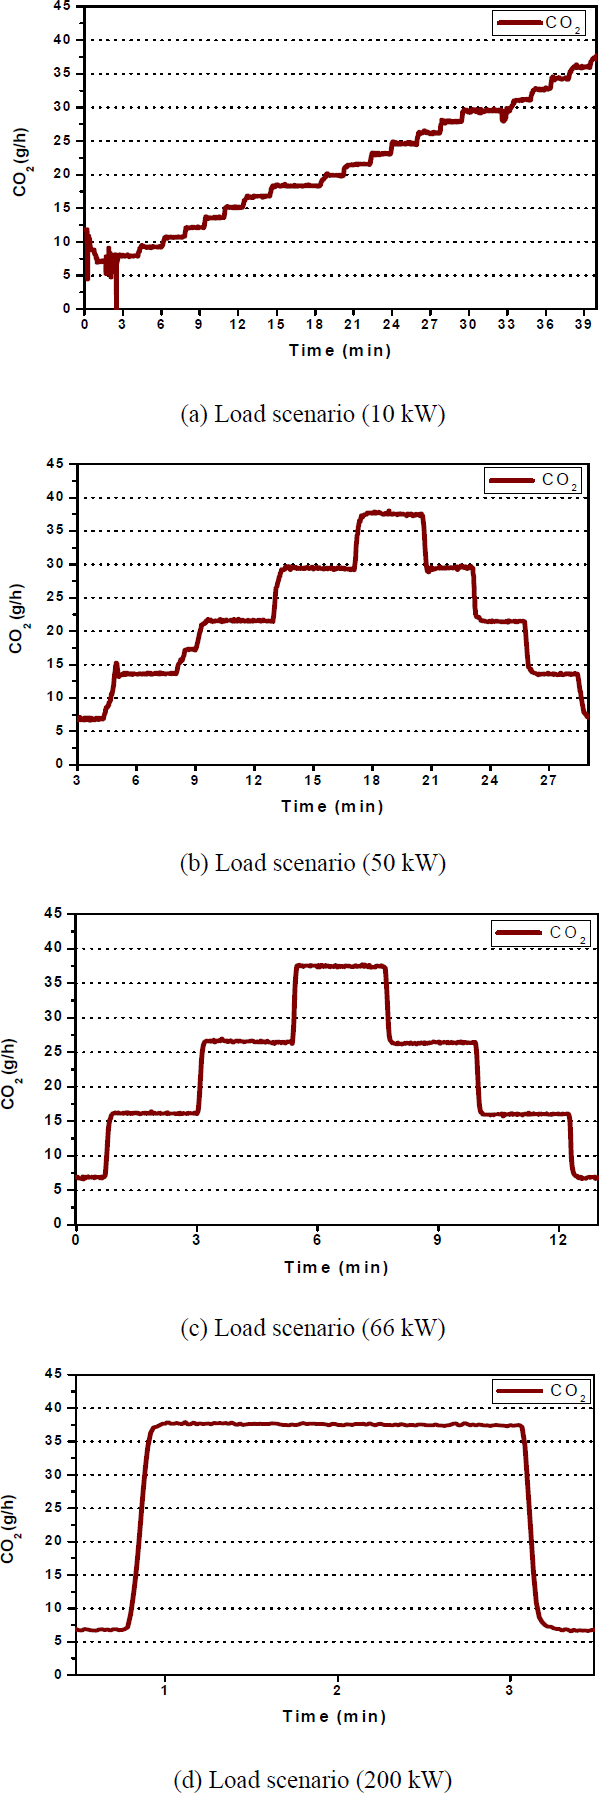
Figure 8 shows the CO2 emissions for each load based on the calculation formula, expressed in the form of a graph.
The carbon dioxide emissions for each load were calculated using Equation (1) based on the SFOC measured per unit output, where the minimum and maximum emissions were 8 and 36 g/h, respectively.
The shape of the graph in Figure 8 indicates that the carbon dioxide emission is proportional to the load.
This can be understood in terms of the concept of the SFOC, which expresses the amount of fuel consumed over a certain period of time, where the combustion of fuel composed of carbon and hydrogen generates energy while simultaneously emitting carbon dioxide and water. The trend confirms that the increase or decrease in the carbon dioxide emission differs according to the increase or decrease in the SFOC.
3.4 Comparison of Diesel Engine Data
The engine in this study is designed as an auxiliary engine to supply power for the propulsion of a ship and the power required for onboard residence under conditions of sailing at a standard speed. To confirm its feasibility as a commercially suitable auxiliary engine and verify the experimental parameters for the LPG engine, the data acquired using a diesel engine as an emergency generator for an actual 8000 ton marine training vessel are presented for comparison.
In other words, based on the data for diesel engines with similar outputs, evaluating the environmental and performance aspects for comparison with the LPG engines evaluated herein is instructive. The characteristics of the diesel engine are similar to those of the LPG engine at 1800 rpm and 163 kW. Based on the average values from the trial-run tests according to Chapter 1, Part 6 of the KR rules, the calculated CO2 emissions and SFOC values are presented in Table 4.
The amount of nitrogen oxides emitted by the LPG engine in this study was in the range of 0.06‒1.7 g/kWh under each load, which falls within the range of 2 g/kWh, which is the emission allowance standard for ships under the IMO Tier III and the Clean Air Conservation Act. Figures 9 and Figure 10 present the average values for each item.
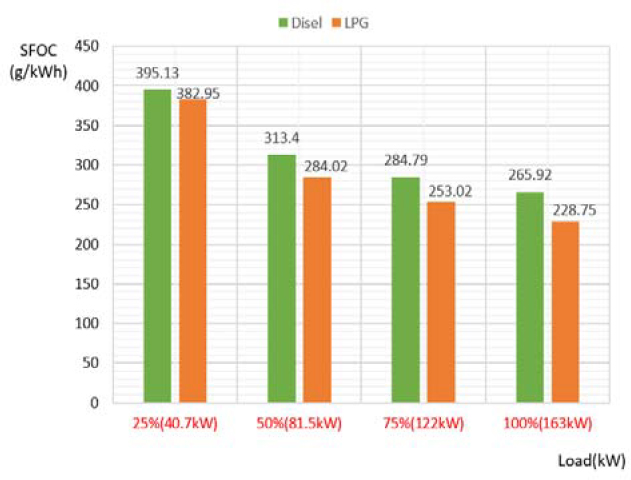
Figure 9 shows a graph comparing the SFOC values for the LPG and diesel engines.
Comparison of the SFOC of the LPG engine and the diesel engine under the same load shows that the LPG engine is more advantageous in terms of the SFOC, with minimum and maximum values of 228.75 and 382.95 g/kWh respectively, as compared to those of the diesel engine, having minimum and maximum values of 265.92 and 395.13 g/kWh, respectively.
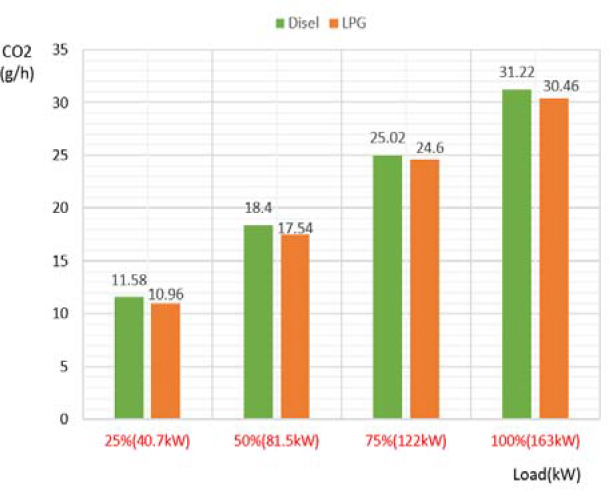
Figure 10 presents a comparison of the carbon dioxide emissions of the LPG and diesel engines Based on the average fuel consumption per unit output under the same load, the LPG engine afforded a minimum and maximum emission of 10.96 and 30.46 g/h, compared with a minimum and maximum emission of 11.58 and 31.22 g/h, for the diesel engine, respectively. The emission of the LPG engine was approximately 0.7 g/h lower on average compared with that of the diesel engine. This is consistent with previous studies showing that the carbon dioxide and carbon-compound emissions of engines using LPG fuel are lower than those of diesel engines because of the low carbon content of LPG [14].
The results of these studies show that the theoretical assumptions regarding the effect of the fuel type on carbon dioxide emissions from engines are consistent with the actual measurement results. This is an important finding for reducing carbon dioxide emissions from ships.
4. Conclusion
This study was conducted with the aim of analyzing the performance of small- and medium-sized marine LPG engines for making ecofriendly and economical choices, and for evaluating the applicability of these engines in ships. Thus, the possibility of LPG serving as a bridge fuel between existing and new energy sources while meeting the environmental regulations of ships was explored. To achieve this goal, this study experimentally analyzed the NOx, SFOC, and CO2 emissions from LPG engines under various load scenarios. The results of this study are summarized as follows:
Firstly, the LPG engine used in this study adopted a liquid fuel injection method with the aim of improving the power and fuel efficiency and reducing NOx emissions by accurately controlling the air-fuel ratio. The tests showed that the IMO Tier III nitrogen oxide emission standard of 2 g/kWh was satisfied in all scenarios. Detailed analysis of the NOx emissions indicated that most scenarios met the standard. However, in scenarios where the load changed drastically, the fluctuations in the nitrogen oxide emissions were significant, attributed to the effects of the air-fuel ratio imbalance and the reaction rate of the three-way catalyst.
Secondly, we examined the relationship between the engine load and SFOC in various scenarios, demonstrating that the SFOC decreases continuously as the engine load increases. The SFOC was the lowest at the peak load of 200 kW, and the decline was even more pronounced in certain sections. These results are consistent with previous research showing that increasing the engine power significantly reduces the SFOC.
Thirdly, the carbon dioxide emissions from LPG engines were measured to be between a minimum of 8 g/h and maximum of 36 g/h, which is similar to the trend for the SFOC. These results show an association between the increase and decrease in the SFOC and carbon dioxide emissions. The carbon content of LPG per liter is low, which is consistent with previous studies showing that the carbon dioxide and carbon-compound emissions of engines using LPG are lower than those of diesel engines. This shows that the theoretical assumptions regarding the impact of the fuel type on carbon dioxide emissions from the engine are consistent with the actual measurements. These findings are expected to be important in reducing carbon dioxide emissions from ships.
Finally, a comparative analysis was conducted using a diesel engine with an output similar to that of the LPG engine. The LPG engine was more advantageous in terms of the SFOC and exhibited lower carbon dioxide emissions. This shows that LPG engines are superior to diesel engines not only in terms of environmental impact, but also in terms of fuel efficiency, confirming the potential of LPG engines as an eco-friendly and economical alternative to ship propulsion systems. The results of this study provide fundamental data for future research and development regarding alternative fuels and are expected to serve as an experimental basis for the application of LPG engines in various types of vessels in the future.
Author Contributions
Conceptualization, K.Y Han and H.G Lim; Methodology, K.Y Han; Software, K.Y Han; Formal Analysis, K.Y Han and J.W Lee; Resources, K.Y Han; Data Curation, K.Y Han and H.G Lim; Writing-Original Draft Preparation, K.Y Han; Writing-Review & Editing, K.Y Han and H.G Lim; Visualization, K.Y Han; Supervision, J.W Lee; Project Administration, J.W Lee.
References
- Y. S. An, et al, A Study on Management Standards and Assessment Model for the Atmospheric Environment of Ports, Basic report 2020-06, Korea Maritime Institute, 2020 (in Korean).
- International Maritime Organization (IMO), https://www.imo.org/en/MediaCentre/MeetingSummaries/Pages/MEPC-80.aspx, , Accessed on July 3-7, 2023.
-
H. S. Jang, J. W. Lee, K. K. Lee, and J. S. Choi, “Prediction of NOx emission for marine gas engines,” Journal of the Korean Society of Marine Engineering, vol. 38, no. 6, pp. 658-665, 2014 (in Korean).
[https://doi.org/10.5916/jkosme.2014.38.6.658]

-
J. S. Kim and J. H. Choi, “Feasibility study on bio heavy fuel as an alternative for marine fuel,” Renewable Energy, vol. 219, Part 2, p. 119543, 2023. .
[https://doi.org/10.1016/j.renene.2023.119543]

- H. J. Kang, “Marine decarbonization fuel prospects,” Bulletin of the Society of Naval Architects of Korea, vol. 59, no. 3, pp. 2-7, 2022 (in Korean). .
-
K. W. Chun, M. Kim, and J. J. Hur, “Development of a marine LPG-fueled high-speed engine for electric propulsion systems,” Journal of Marine Science and Engineering, vol. 10, no. 10, p. 1498, 2022. .
[https://doi.org/10.3390/jmse10101498]

-
K. C. Noh, D. I. Seol, K. M. Heo, and S. H. Kim, “Development and Performance Evaluation for 1.6㎿. Gas Engine,” Journal of the Korean Society of Marine Engineering, vol. 36, no. 2, pp. 230-237, 2012 (in Korean).
[https://doi.org/10.5916/jkosme.2012.36.2.230]

-
N. T. Tuan and N. P. Dong, “Theoretical and experimental study of an injector of LPG liquid phase injection system,” Energy for Sustainable Development, vol. 63, pp. 103-112, 2021.
[https://doi.org/10.1016/j.esd.2021.06.002]

-
J. Dixon, D. Middleton, and R. G. Derwent, “Using measurements of nitrogen oxides to estimate the emission controls required to meet the UK nitrogen dioxide standard,” Environmental Monitoring and Assessment, vol. 65, pp. 3-11, 2000.
[https://doi.org/10.1007/978-94-010-0932-4_1]

-
Z. Zhang, W. Wan, W. Zhang, Q. Liu, R. Zhao, Y. Chen, and Q. Qin, Research of the impacts of incylinder steam injection and ignition timing on the performance and NO emission of a LPG engine, Energy, vol. 244, Part B, 123193, 2022.
[https://doi.org/10.1016/j.energy.2022.123193]

- S. Y. Park, “Development of the small size engine for general purpose,” Journal of Korea Academia-Industrial cooperation Society, vol. 11b, pp. 839-841, 2010 (in Korean).
-
S. J. Lee and J. K. Lim, “Calculation of CO2 emission w.r.t. instantaneous generator output using input-output coefficients of thermal power plant,” Journal of the Korean Institute of Illuminating and Electrical Installation Engineers, vol. 21, no. 5, pp. 120-125, 2007 (in Korean).
[https://doi.org/10.5207/JIEIE.2007.21.5.120]

- Ministry of Trade, Industry and Energy of Korea, https://www.law.go.kr/LSW/lsInfoP.do?lsId=010281&ancYnChk=0#0000, , Accessed on November 21, 2022 (in Korean).
- J. C. Lee, M. H. Lee, K. H. Kim, and A. Y. Park, “A study on the emission characteristics of greenhouse gases according to the vehicle technology, fuel oil type and test mode,” Journal of the Korean Applied Science and Technology, vol. 34, no. 4, pp. 962-973, 2017 (in Korean).

