Hydrophobic surface fabricated by electrospinning for advanced piezoelectric sensor
Copyright ⓒ The Korean Society of Marine Engineering
This is an Open Access article distributed under the terms of the Creative Commons Attribution Non-Commercial License (http://creativecommons.org/licenses/by-nc/3.0), which permits unrestricted non-commercial use, distribution, and reproduction in any medium, provided the original work is properly cited.
Abstract
Electrospinning is very useful technique to fabricate micro and nanofibers for various applications such as texturing, scaffold fabrication and etc. Recently, many researchers have studied about self-cleaning membranes. Superhydrophobic self-cleaning, also known as the lotus effect, uses the right combination of micro and nano structures to create very high contact angles on the surface and keep water droplets away from the surface. Water droplets with large contact angles are easily rolled off the surface and carry dust, particles and other contaminants by gravity so it is very useful for advanced piezoelectric sensor. In this study, we developed by combining melt electrospinning device with solution electrospinning device to fabricate hydrophobic surface. Also, injection molding device was created for a comparison of various structures such as pure structure (nano, micro, and macro) and composite structure (nano/micro and nano/micro/macro). To test contact angle of various structures, optical tensiometer, manufactured by DYNE technology, England, was used. As a result, we fabricated various electrospun fibers in terms of diameter using controlling parameters such as applied voltage, collector distance, flow rate, and nozzle size. Moreover, we measured the time to maintain the water contact angle on the proposed structures. Finally, we concluded that the composite structure is better than pure structure for fabricating hydrophobic self-cleaning surface.
Keywords:
Microfiber, Nanofiber, Self-cleaning for advanced piezoelectric sensor, Electrospinning, Hydrophobic surface1. Introduction
When the lotus leaves have raindrops, they retain the form of drops of water since leaves have very small protrusions that do not absorb or spread. Having this structure is called hydrophobic surface. To make hydrophobic surfaces, micro structure and nano structure are required such as the micro/nano-bumps, that lotus leaves have. Many researchers have studied to create micro or nano structures using solidification of melted Alkyl Ketene Dimer (AKD, a kind of wax) [1], anodic oxidization of aluminum [2], mixing of a sublimation material with silica or boehmite [3].
Hydrophobic surfaces are needed for many applications involving water repellency, prevention of the adhesion of snow, fog and contamination, self-cleaning and antifouling properties [4]-[8]. Of many advantages of hydrophobic surfaces, we are interested in self-cleaning for advanced piezoelectric sensor. In self-cleaning, water droplets are made in spherical form with high water contact angle by hydrophobic surface, and droplets fall by gravity. Drop of water falling on the surface of the contaminated material is caught and fall together to prevent contamination of the fiber, and also to prevent contamination of the skin. The liquid on the surface can be easily removed, thereby protecting against corrosion and oxidation. In many experiments, in order to make self-cleaning, TiO2 was used as a photo catalyst to shoot ultraviolet rays and use photolysis [9]. This method takes a long time to make a surface of self-cleaning. So, we used electrospinning technology to reduce time by spinning materials and roughing the surface structure to create hydrophobic surfaces.
There are two ways to make a rough surface: first, to roughen the surface with physical elements and secondly to send low energy to the surface to make the surface rough. Electrospinning is the first way of making it. In electrospinning, the method of melt electrospinning, which is made by putting Poly (ε-caprolactone) (PCL), which is a material, in the chamber and dissolving it into the heating system, and the solution electrospinning, in which the material is made by mixing methanol in the PCL. These technologies produce microfibers and nanofibers. PCL sheet is made through injection molding, which melts PCL as a base and presses it with a plate. The combination of PCL sheets, microfiber, and nanofiber make composite structures (micro-nano, PCL micro, PCL micro-nano). We drop water droplets on these samples to find out the angle and to find out how much the angle changed after 30 minutes through optical tensiometer. Through experiments, we will find a sheet that is hydrophobic and has a long-lasting effect and apply it to self-cleaning.
2. Fabrication methods and contact angle measurement
2.1 Electrospinning
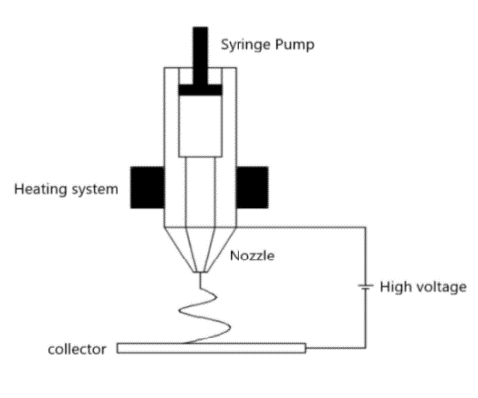
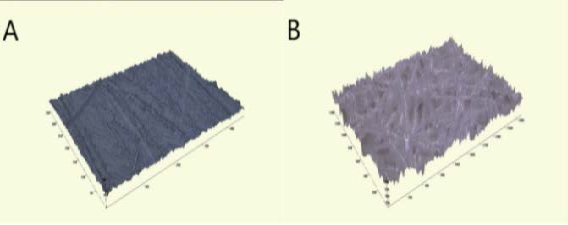
The prepared PCL is placed in the melting chamber of the syringe pump and heat up to 80 ℃ through a heating system to produce a uniform polymer fusion [10][11] as shown in Figure 1. After that, the microfiber sheet is fabricated with a voltage of 20 kV, a nozzle size of 200 μm, a flow rate of 2 mL/h and a feed rate of 8.5 mm/s [10][11]. Figure 2 (B) is a profilometer image of the microfiber. Through Ten experiments are conducted under the same conditions, a sheet with a thickness of 1.9 mm and a roughness of 948 μm is produced. In Figure 3 (A), the roughness is big, so it rises ruggedly from the side. The water contact angle increases as it supports the water droplet.
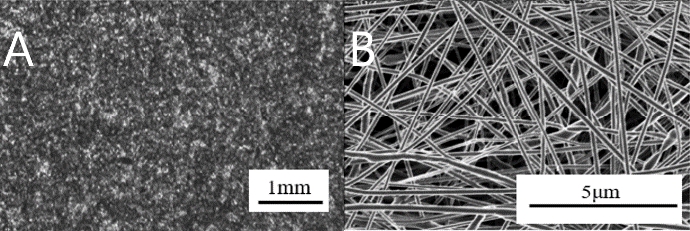
Solution electrospinning prepare a 7:1 mixture of PCL, chloroform/methanol and DCM/methanol, and stored 10 % PCL solution in a bench top stirrer (Corning®) at 1000 rpm at room temperature. Thereafter, the solution is maintained at 4 ℃ until the experiment. After that, nanofiber sheet is fabricated with a voltage of 20 kV, a nozzle size of 200 μm, a flow rate of 2 mL/h and a feed rate of 8.5 mm/s under the same conditions of melt electrospinning. Put the stored solution in the chamber and give it a voltage, and the solution is sprayed into the collector. As the solution is sprayed, it evaporates methanol, leaving PCL as a nano particle in the collector, which is called nanofiber. Figure 4 (A) is scattered rather than made of nanofiber sheet. It is so small that it is difficult to form a sheet. In Figure 4 (B), the entangled tissue can be identified when enlarged. Figure 3 (C) shows the microfiber sprinkled on the nanofiber. Therefore, the nanofiber sticks to the microfiber, which causes the water contact angle to be larger than that of the microfiber.
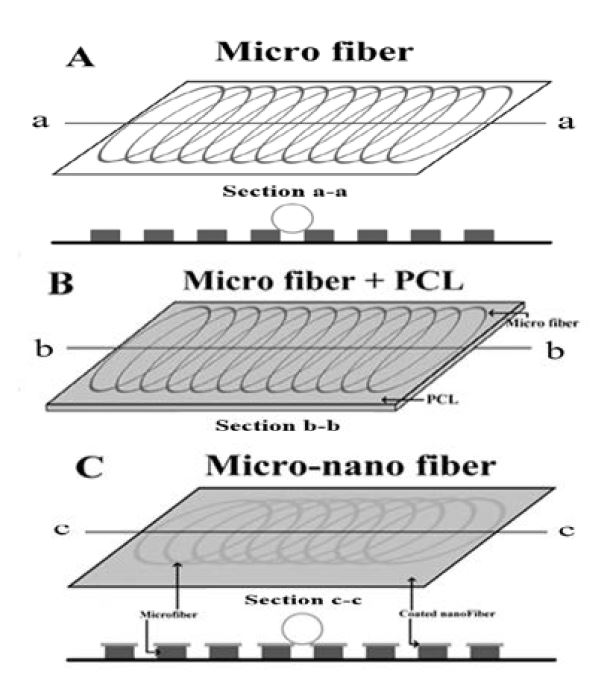
Schematic of various geometrical sample sheets (A) microfiber, (B) PCL microfiber, (C) micro-nanofiber
2.2 Injection molding
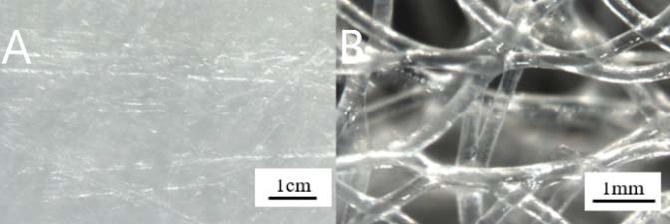
We prepare PCL with a melting point of 60 ℃ by purchasing Sigma Aldrich, USA (Mn~45,000) and melt the PCL by raising the temperature of the preheated bottom [12]. Then push the plate above it to the floor below it with the melted material. Then we cooled the PCL sheet. Figure 5 (A) is a picture of a bar with a gap of 1 cm. Compared with Figure 5 (B) and Figure 4 (A), the texture of the surface is unseen and clustered. Figure 2 (A) shows the profile of the PCL as a profilometer image. The average thickness of the sheet is 1.1 mm and the roughness is 41 μm. Figure 3 (B) shows the microfiber created on the PCL sheet. As the water droplets rise on the microfiber, an air layer is formed between the PCL and water droplets. It keeps the air from falling down and keeps the high angle for a long time.
2.3 Water contact angle measurement
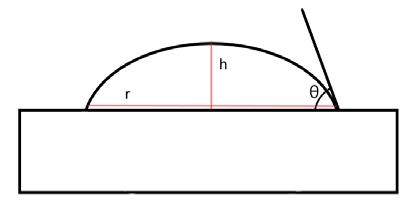
There are two ways to measure the water contact angle. The first method is to measure the angle directly from photographic film [12]. The second method is to calculate the theoretical angle using the formula [12]. If the effect on gravity is no nearly equal to the water drop, calculate r and has in Figure 6. The angle can be calculated using the Equation (1). We measured using an optical tensiometer, manufactured by DYNE technology, England.
| (1) |
3. Experimental Results
3.1 Water contact angle when dropped on each sheet
Figure 7 (A) shows a drop of water on the PCL sheet. The shape of the water drop is almost hemispherical. Its angle is 78.6 ° ± 3 °. The rougher the surface, the bigger the angle because it supports the droplets. However, the PCL sheet is not rough enough to support the droplets, so the angle becomes smaller.
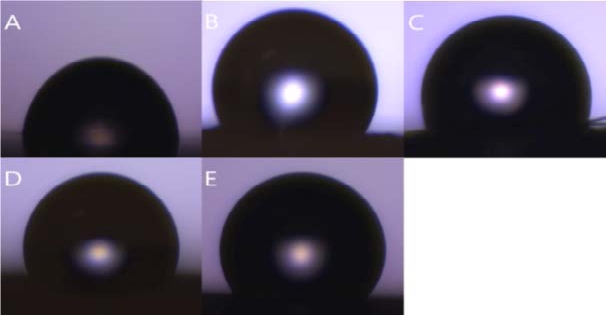
Water contact angle (WCA) shape (A) PCL, (B) Mi-crofiber, (C) PCL microfiber, (D) Micro-nanofiber, (E) PCL micro-nanofiber
Figure 7 (B) and (C) are droplet shapes on microfiber and PCL microfiber respectively. The water droplets on both sheets show a more aspherical shape than the shape of Figure 7 (A). The surface of the water droplets is roughened by the microfibers, which support the droplet, causing the angle of the water droplet to be greater than Figure 7 (A). The angles are 126.3 ° ± 5 ° and 123.7 ° ± 6 °, respectively.
Figure 7 (D) and (E) are forms on micro-nanofiber and PCL micro-nanofiber respectively. As the nanofiber is sprayed on the microfiber, the water droplets are better supported, resulting in a greater angle than Figure 7 (A), (B), and (C). The angles are 133.4 ° ± 2 ° and 132.7 ° ± 2 °, respectively. Ten experiments were conducted under the same conditions and ten average values were shown in Table 1.
3.2 Variation of water contact angle over time
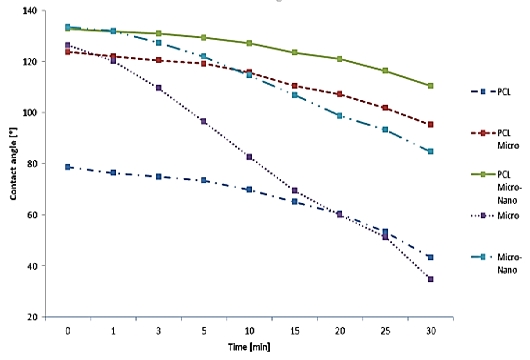
Figure 8 is the water contact angle on each sheet as a graph. The graph shows the degree of variation in the angle of the droplet on each sample. Figure 9 shows the droplet contact angle change on the PCL sheet for 30 minutes. The hemispherical shape of the water droplet spreads over time. The angle also decreased 35.3 ° from 78.6 ° to 43.3 °. The surface is not rough enough to support the droplets, and it spreads over time. Figure 10 shows the droplet shape change on the microfiber for 30 minutes. In Figure 10 (A), the droplet with spherical shape is spread like water droplet like Figure 9 (I) after 30 minutes. The angle also decreased 92.3 ° from 126.3 ° to 34.8 °, indicating the greatest angle change among all the sheets. The small bumps on the surface support the droplet of water to give it a large angle, but over time, the angle decreases dramatically as it falls between the bumps. Figure 11 shows the droplet shape change on the PCL micro-nanofiber for 30 minutes. The sphere form is maintained even though the water droplet changes. The angle also decreased 23.4 ° from 132.7 ° to 110.4 °, showing the smallest angle change among all the sheets. The small bumps on the surface support the droplets to form a large angle and create an air layer between the PCL sheet and the water droplets that fall through the bumps. The decrease in angle is due to the evaporation of droplets over time, which is irrelevant because all samples are in the same situation.
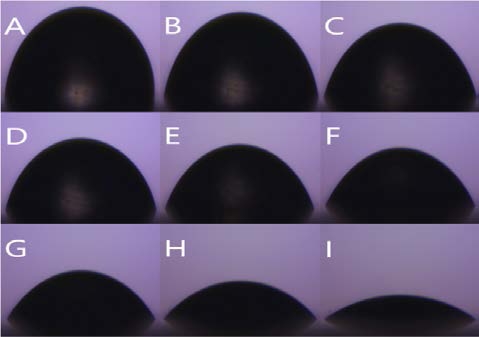
Contact angle variation with time (PCL) shape (A) 0 min (B) 1 min (C) 3 min (D) 5 min (E) 10 min (F) 15 min (G) 20 min (H) 25 min (I) 30 min
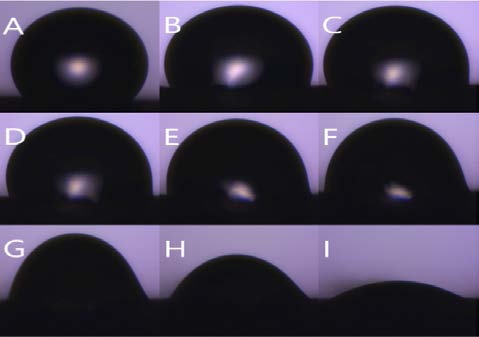
Contact angle variation with time (Microfiber) shape (A) 0 min (B) 1 min (C) 3 min (D) 5 min (E) 10 min (F) 15 min (G) 20 min (H) 25 min (I) 30 min
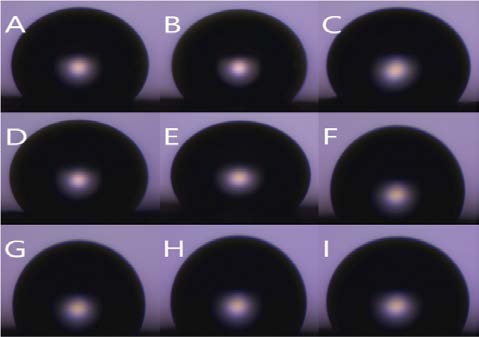
Contact angle variation with time (PCL micro-nanofiber) shape (A) 0 min (B) 1 min (C) 3 min (D) 5 min (E) 10 min (F) 15 min (G) 20 min (H) 25 min (I) 30 min
In Table 2, the PCL microfiber shows the change of 28.5 ° from 123.7 ° to 95.2 °, and micro-nanofiber shows the change of 48.7 ° from 133.4 ° to 84.7 °.
4. Conclusions
Microfiber and nanofiber play roles of very small protrusion in the lotus leaves and play major roles in keeping the water droplet at a large angle. However, with the nano-microfiber alone supported by water droplets have limitations to keep the water droplets falling into the spaces between the protrusions that have been supported over time and to be maintained for a long time. Thus, PCL can help to maintain a large angle for a long time. Because PCL creates an air layer between the droplets and PCL sheet, this prevents water droplets from falling into the supporting space. If the liquid goes down for a while on the surface during self-cleaning, it will be made with nano-microfiber in terms of production time and cost. However, PCL micro-nanofiber is suitable for self-cleaning because water is not absorbed for a long time and is dropped by gravity or evaporated over time. Therefore, we conclude that PCL micro-nanofiber is suitable for self-cleaning of advanced piezoelectric sensor.
Acknowledgments
This research was supported by Basic Science Research Program through the National Research Foundation of Korea (NRF) funded by the Ministry of Education and Ministry of Science (2019R1G1A1009980).
Author Contributions
Conceptualization, J. Ko; methodology, J. Ko and H. Han; Software, H. Han; Formal Analysis, J. Ko and H. Han; Investigation, H. Han; Resources, J. Ko and H. Han; Data curation H. Han; Writing-Original Draft Preparation, J. Ko and H. Han; Writing-Review & Editing, J. Ko and H. Han; Visualization, J. Ko and H. Han; Supervision, J. Ko ; Project Administration, J. Ko; Funding Acquisition, J. Ko.
References
-
T. Onda, S. Shibuichi, N. Satoh, and K. Tsujii, “Super-water-repellent fractal surfaces,” Langmuir, vol. 12, no. 6, pp. 2125-2127, 1996.
[https://doi.org/10.1021/la950418o]

-
K. Tsujii, T. Yamamoto, T. Onda, and S. Shibuichi, “Super oil-repellent surfaces,” Angewandte Chemie International Edition in English, vol. 36, no. 9, pp.1011-1012, 2003.
[https://doi.org/10.1002/anie.199710111]

-
A. Nakajima, A. Fujishima, K. Hashimoto and T. Watanabe, “Preparation of transparent superhydrophobic boehmite and silica films by sublimation of aluminum acetylacetonate,” Advanced Materials, vol. 11, no. 16, pp. 1365-1368, 1999.
[https://doi.org/10.1002/(SICI)1521-4095(199911)11:16<1365::AID-ADMA1365>3.0.CO;2-F]

-
Y. Miyauchi, B. Ding and S. Shiratori, “Fabrication of a silver-ragwort-leaf-like super-hydrophobic micro/nanoporous fibrous mat surface by electrospinning,” Nanotechnology, vol. 17, no. 20, pp. 5151, 2006.
[https://doi.org/10.1088/0957-4484/17/20/019]

-
A. Nakajima, K. Hashimoto, and T. Watanabe, Recent studies on super-hydrophobic films,” Molecular Materials and Functional Polymers, U. Schubert, Ed. Vienna: Springer, 2001.
[https://doi.org/10.1007/978-3-7091-6276-7_3]

-
A. Lafuma and D. Quéré, “Superhydrophobic states,” Nature Materials, vol. 2, no. 7, pp.457-460, 2003.
[https://doi.org/10.1038/nmat924]

-
R. Blossey, “Self-cleaning surfaces — virtual realities,” Nature Materials, vol. 2, no. 5, pp.301-306, 2003.
[https://doi.org/10.1038/nmat856]

-
S. S. Madaeni and N. Ghaemi, “Characterization of self-cleaning RO membranes coated with TiO2 particles under UV irradiation,” Journal of Membrane Science, vo1. 303, no. 1-2, pp.221-233, 2007.
[https://doi.org/10.1016/j.memsci.2007.07.017]

-
S. K. Bhullar, J. H. Ko, Y. H. Cho, and M. B. G. Jun, “Fabrication and characterization of nonwoven auxetic polymer stent,” Polymer-Plastics Technology and Engineering, vol. 54, no. 15, pp. 1553-1559, 2015.
[https://doi.org/10.1080/03602559.2014.986812]

-
J. H. Ko, V. Ahsani, S. X. Yao, N. K. Mohtaram, P. C. Lee, and M. B. G. Jun, “Fabricating and controlling PCL electrospun microfibers using filament feeding melt electrospinning technique,” Journal of Micromechanics and Microengineering, vol. 27, no. 2, 025007, 2016.
[https://doi.org/10.1088/1361-6439/aa4fd9]

-
J. Ko, “Fabrication and characterization of novel stretchable force sensors using melt electrospinning,” Journal of the Korean Society of Marine Engineering, vol. 42, no. 10, pp. 794-799, 2018.
[https://doi.org/10.5916/jkosme.2018.42.10.794]

-
W. Zhang, M. Wahlgren, and B. Sivik, “Membrane characterization by the contact angle technique: II. Characterization of UF-membranes and comparison between the captive bubble and sessile drop as methods to obtain water contact angles,” Desalination, vol. 72, no. 3, pp. 263-273, 1989.
[https://doi.org/10.1016/0011-9164(89)80011-6]


