Performance evaluation of Ocean Thermal Energy Conversion(OTEC) stabilization based on risk analysis
Copyright © The Korean Society of Marine Engineering
This is an Open Access article distributed under the terms of the Creative Commons Attribution Non-Commercial License (http://creativecommons.org/licenses/by-nc/3.0), which permits unrestricted non-commercial use, distribution, and reproduction in any medium, provided the original work is properly cited.
Abstract
Research and development of OTEC, a renewable energy power generation facility using seawater heat, is underway world-wide, and the development of a demonstration plant has been promoted in Korea. However, for the commercialization of OTEC, alternative operating scenarios must be derived for various environmental changes. Therefore, preemptively identifying the risk factors of the system, analyzing the effects of the system, establishing control items, and verifying the results through simulation are necessary. This study proposes a method to minimize risk factors along with a risk analysis of the risk factors of MW-scale OTEC, such as refrigerant leakage and riser loss. The selected OTEC was designed for 1070 kW-class facilities, and 36.6% of the total power is consumed by seawater pumps and refrigerant pumps. The refrigerant was assumed to be leaked owing to the opening of the valve to the top of the refrigerant tank, and the performance change was confirmed by assuming that the refrigerant leaked at an average rate of approximately 21 kg/s. In addition, the riser loss assumed a rapidly changing deep water temperature, and the system was operated to stop when the deep water temperature increased up to 18°C.
Keywords:
Hazard analysis, Ocean thermal energy conversion, Subsystem risk analysis, Refrigerant leakage, Riser loss1. Introduction
Ocean thermal energy conversion (OTEC) technology is a method for generating electricity using the temperature difference between relatively warm surface seawater and deep seawater. This technology is characterized by seawater and a high operation rate throughout the year [1] owing to the small temperature change in the seawater.
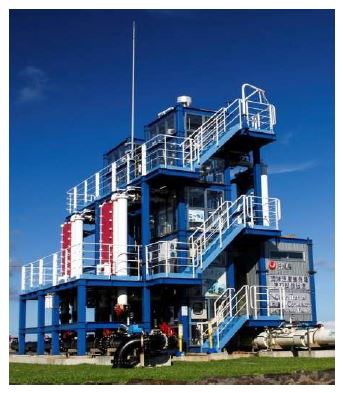
The closed cycle is the most common method used in OTEC. In the case of closed-type OTEC, pilot and demonstration plants are being actively constructed in Japan, Europe, and other countries as for the following of precedent 50 kW plant built in the United States in 1979. Figure 1 shows the OTEC demonstration plant in Okinawa, Japan. South Korea was the fourth country to construct a pilot-scale plant of 20 kW in 2013 [2], and is currently designing and constructing a demonstration plant of 1 MW in Kiribati, a South Pacific island country [3]-[5]. In addition, research on the performance analysis of seawater temperature difference power generation has been steadily progressing, and recently, the performance characteristics according to environmental changes such as seawater temperature have been analyzed [6].
The essential analysis for commercialization and practical use of the OTEC is risk analysis. Hazard analysis is a systematic approach for identifying and assessing hazards in workplaces or facilities. Accordingly, hazard analysis is necessary to ensure safety in terms of dangerous circumstances that may occur, such as loss of human lives, resources, or properties [6].
Hazards derived from the analysis are separated into several groups of similar occasions (destruction of apparatus and environmental issues), thus analyzing the list of possible risk occurrences. Hazards are then classified using a “risk matrix” that sorts the list of hazards into low-risk, medium-risk, or high-risk groups, depending on the frequency of occurrence of the risk factor and severity of consequences [7]. The main purpose of this analysis is to figure out the potential risks that may affect the subject and to develop countermeasures for each case.
In addition, risk analysis for offshore plant stability evaluation and risk analysis through a Preliminary Hazard List Analysis of carbon capture and storage facilities are being performed [8]-[9]. This study conducted hazard analysis on precedent MW-scale OTEC operation and design to determine the severity of various hazard occurrences. The risk value was analyzed by applying the performance change for the refrigerant leakage and riser loss. However, unlike the previous risk analysis, this study analyzed the effect on the system according to the risk factors obtained through the risk analysis and also suggested a plan to secure safety.
2. Hazard analysis
2.1 Hazard analysis of MW-Scale OTEC
In this study, the hazard analysis of MW-scale OTEC was performed in three steps. Preliminary Hazard List Analysis (PHL) constructs a list of hazard-causing potentials. This is followed by Preliminary Hazard Analysis (PHA), where causes and effects and solutions of hazards are established. A more detailed classification is performed based on the results of PHA, through Subsystem Hazard Analysis (SSHA) [10]. For the aforementioned analysis, experts in related technologies were invited to derive classification, action plans, and cause analysis through discussion. Here, hazard analysis was used as the first step in the process used to assess risk. The result of hazard analysis was the identification of different types of hazards. A hazard is a potential condition.
Prior to PHL, the components of the MW-scale OTEC were categorized into six groups: floating body of the OTEC system, mooring system that supports the body, foundation structures of seabed surface, riser system for inflow of deep seawater, power generation facilities, and seawater intake equipment.
OTEC is classified into land and sea types according to the configuration location, and the power generation facilities are the same; but the pump intake and intake pipes (riser), foundation structures, mooring for sea conditions, and buoyant structures for floating vary depending on the location.
The installation of MW-scale OTEC is currently in progress in Kiribati, an island near the equator. Power generation facilities are to be mounted on a floating body; therefore, the marine environmental impact of the installation area should be considered important.
Hazard analysis based on the detailed components of the system consists of design knowledge, risk knowledge, and hazard analysis knowledge of similar cases. Table 1 presents the results of the PHL based on standardized knowledge.
From the results, the structural damage caused by the marine environment was regarded as severe as the case emerged in every item. The occurrence of such hazards leads to sinking, loss, or destruction of the structure. Other effects drawn from the PHL were the loss of structures owing to weather phenomena and corrosion caused by prolonged seawater exposure.
Hazards of foundation structures lacked data on deep seawater and the changing temperature of intake water owing to breakage of the riser. Efficiency decline accounted for a great portion of both generation and seawater intake facilities.
Because this study aims to improve performance and stabilize power generation, only hazards based on the causes and effects of performance degradation were considered for PHA. The hazard analysis results of the entire OTEC system can be seen in the report of the subscript in MW OTEC [11]. The report introduces a series of OTEC development processes conducted in Korea and presents the results of the risk analysis among them.
In addition to the hazard list, as described in Section 2.1.1, the PHA deals with information about top-level mishaps. Therefore, new threats can be added or threats that are considered meaningless can be removed. In accordance with the PHL results from Section 2.1.1, hazard items are classified into “buoyant structures,” “mooring system,” “foundation structures,” “riser system,” “generation facilities,” and “sea-water intake pipe system.” Table 2 presents the results of PHA that correspond to the elements related to the degradation of power generation.
The detailed risk factors of system items derived from PHL are classified in PHA, and action items are suggested by experts.
Hazards on riser breakage is mainly caused by damage to connections or the destruction of structures. The main reason for this hazard occurrence is the long-term exposure to deep seawater and external damage. Moreover, this hazard can cause further effects, such as foreign substances entering the damaged parts, that are directly linked to the system failure of the OTEC. Moreover, owing to the invasion of surface seawater, it can lose its function as a heat sink.
This problem directly affects the condensation of the working fluid, significantly impacting the turbine output. To solve this problem, the adoption of an emergency shut-off valve or other flow control devices in the refrigerant pump is considered necessary.
Shut down of the seawater pump is caused by inflow of particles. The consequence of this hazard is damage to the riser. In other words, this hazard damages the riser.
Moreover, the interruption of the seawater inflow can lead to a liquid-phase working fluid entering the turbine that can damage the turbine apparatus. The preparation of sub-refrigerant pumps or emergency water intake pipes can improve this situation.
The R32 working fluid was used as the refrigerant for the OTEC in this study. Owing to the characteristics of evaporation at low temperatures and combustibility, the leakage of this refrigerant can cause environmental issues or human casualties. Problems such as the reduction of refrigerant in the receiver tank owing to leakage and inflow of air into the refrigerant pump are directly related to the reduction in generation efficiency. Therefore, a proper control system must be established, such as an emergency stop valve for the refrigerant pump and a flow control system for the receiver tank, regarding the amount of refrigerant leakage.
Subsystem risk analysis was performed when detailed design information on hazard prevention was available. The purpose of this analysis is to precisely analyze the causes of the risk factors identified in the PHA (Section 2.1.2) and to present appropriate and specific solutions. Items can be added or subtracted during the analysis. Table 3 presents the extracted parts of the MW-scale OTEC SSHA that correspond to the elements related to the degradation of power generation.
The results of SSHA in specific response to the results of PHA derived a new hazard item, “shutdown of seawater pumps and power generation facilities.” The shutdown of power generation facilities leads to the shutdown of the entire plant, leading to a sharp decrease in energy production efficiency and operating rate. Hence, the installation of an emergency seawater pump and a flow control system for a liquid separator is mandatory.
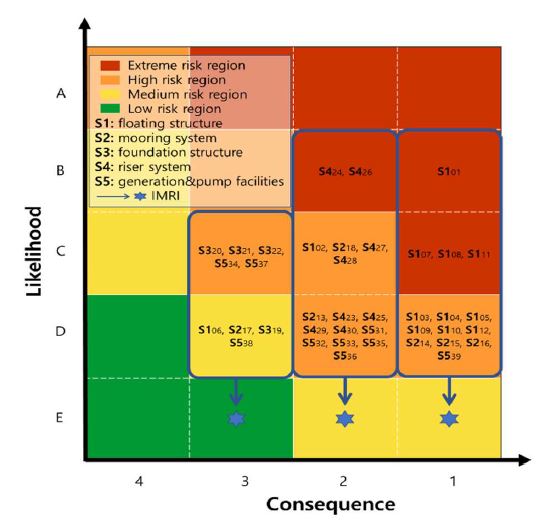
Figure 2 shows the “risk matrix” of the OTEC system derived from the hazard analysis. This is an indicator of hazard factors classified into four groups, extreme, high, medium, and low risk regions, regarding their severity to the system. Hazard factors were set as situations 1–5 (S1~S5) for easier access to the results of the hazard analysis. The subscript in the risk analysis column of the risk matrix represents the number of items derived from the PHA. An initial mishap risk index (IMRI) serves as a qualitative indicator of the importance of the identified hazards [12].
All hazard factors showed a tendency for medium-to-high risk occurrence. This indicates that all hazards require control system improvement. In this study, actions to reduce the hazard effect and occurrence rate were performed using the system performance analysis program, Aspentech HYSYS (V10).
The performance data of the improved system were then compared with the initial (uncontrolled) operation to examine the improvement in the system. HYSYS provides a comprehensive data of thermodynamics for the accurate simulation of physical and transport characteristics and phase behavior by providing reasonable results compared with those of actual industrial plans [13].
3. System performance analysis of OTEC
3.1 Closed-type OTEC system
For the OTEC model, for applying the risk analysis, the basic closed model was selected. The intention is intended to provide a risk measurement and improvement model that applies various risk situations by constructing a development model.
Closed-type OTEC (CC-OTEC) evaporates the working fluid using the temperature difference between surface seawater and deep seawater. The vapor refrigerant passes through a turbine to convert kinetic energy into electricity. The increase in the cycle efficiency is proportional to the temperature difference between the surface and deep seawater. In the case of surface seawater, the temperature varies from 25 to 31°C, depending on seasonal and regional situations. Deep seawater, with a depth of more than 1,000 m, has a temperature of approximately 5°C, irrespective of the region and season [14].
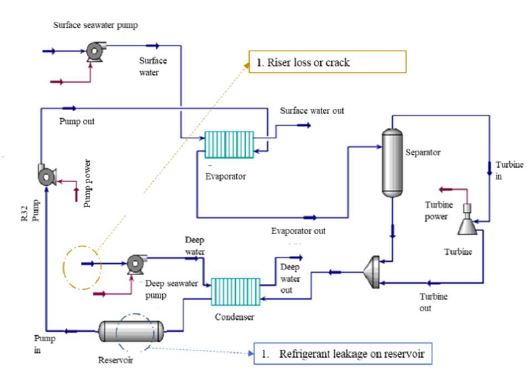
The working fluid, liquefied in the condenser, is stored in a refrigerant tank. Equations (1) and (2) show the total heat of evaporation and condensation, respectively. Equation (3) shows the output for the CC-OTEC turbine, and Equation (4) presents the net power. Figure 3 shows a schematic of the MW-scale CC-OTEC used in this study.
| (1) |
| (2) |
| (3) |
| (4) |
where mr denotes the mass flow rate of the refrigerant, and msw and mdw denote the mass flow rate of the surface water and deep water, respectively. cp denotes the specific heat at constant pressure, and ηtb denotes the turbine efficiency. Tsw and Tdw denote the temperatures of the deep and surface seawater, respectively, and htb denotes the enthalpy of the turbine.
In this case, the net efficiency is calculated using Equation (5), and the outputs of the refrigerant pump, surface seawater, and deep seawater are shown in Equations (6)-(8), respectively:
| (5) |
| (6) |
| (7) |
| (8) |
where ηrp denotes the refrigerant pump efficiency, and ηdwp and ηdwp denote the deep seawater pump and surface seawater pump efficiencies, respectively. hrp, hswp, and hdwp denote the enthalpies of the refrigerant pump, surface, and deep seawater pump, respectively.
3.2 Design of an MW-scale OTEC system
The design of the MW-scale OTEC system was based on that of the 1 MW OTEC model (2019), which is the first OTEC model successfully developed in Korea. Standard operation conditions of seawater temperature are 31°C for surface seawater and 5°C for deep seawater with flow rates of 932.0 kg/s and 1507.0 kg/s, respectively, and 113.4 kg/s for the working fluid. Using the operating conditions listed in Table 4, a maximum output of 1,070.2 kW, heat capacity of 34.47 MW, and an efficiency of 3.1% were achieved. Rated power for pumps were 167.1 kW for deep seawater, 158.9 kW for surface seawater, 65.7 kW for refrigerant. The net power of the OTEC system was 678.2 kW, with an efficiency of 1.97%. The aforementioned results were derived using the Aspen HYSYS program.
In this study, the performance analysis specifics of hazard occurrence during the OTEC operation were simulated. The refrigerant leakage and riser loss results were analyzed among the risk factors that occurred in the risk analysis. (1) Refrigerant leakage: external damage, pressure rise in the internal structure, fatigue failure of the plant, and unskilled operation technique. (2) Riser loss or crack: earthquake, tsunami, aging of riser, and crush with wrecked ships. The reason for the selection is that the risk of the system is extreme and high, and the risk is judged to be reduced through operation control.
Monitoring time for operation was set at 20 minutes, with hazard emerging at 5 min after the start of the operation. The flow rate and temperature of the seawater, flow rate of the refrigerant, heat capacity of the evaporator, output of the turbine, and liquid level change in the liquid separator were monitored. Table 5 lists the dynamic cycle parameters of OTEC.
In this simulation, the storage tank volume was assumed to be 75.4 m3, and the inflow of the gas-phase refrigerant was set to occur at a flow rate point of 2% of the storage tank volume to analyze the consistent operating conditions after hazard occurrence. The liquid-phase refrigerant separated from the 1.5 m3-volume liquid separator was assumed to flow into the turbine after 95% of the separator tank volume.
Inverter control was applied to the operating fluid pump in accordance with the seawater temperature change, and an RPM change of 40 was applied according to a 1°C change in the range–950–1150 RPM. The Honeywell PID-A model was used as the working fluid control algorithm.
4. Simulation results of hazard occurrence in OTEC
4.1 Performance change with respect to hazard circumstances
Under standard conditions, the operation characteristics of the turbine power and system efficiency are 1062 kW and 3.1%, respectively. The level of the refrigerant tank was maintained at 27.9%, with a circulating refrigerant flow rate of 113.4 kg/s. This operational status is expected to show a decline in efficiency in various situations of system disorders, such as low-level tanks and temperature changes.
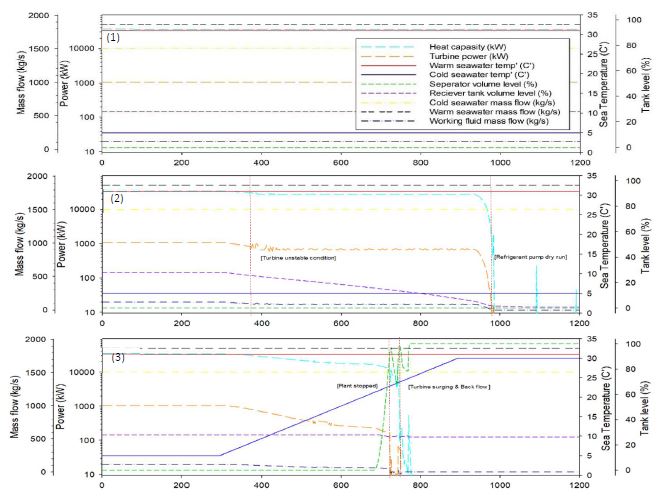
The performance results implied that the flow rate of the refrigerant tank level gradually decreased from 27.9% as refrigerant leakage occurred 300 s after the start of operation. The flow rate of the refrigerant tank decreased by 0.018% per second; after 974 s of operation, only 1.97% of the refrigerant remained in the receiver tank. In addition, the average circulation flow rate was 83.1 kg/s, indicating a decline of 30.3 kg/s.
Output reduced to 703.5 kW on average, in accordance with the decrease in refrigerant flow, and the average heat of evaporation reduced to 27.1 MW. Therefore, the generation efficiency was also reduced from 3.1% to 2.6%. The Inflow rate of turbine also decreased with respect to the refrigerant leak, leading to the unstable status of the turbine. A dry-run operation, with a condition of 0 kg/s pump circulating flow rate, was performed at a refrigerant tank level of less than 2%.
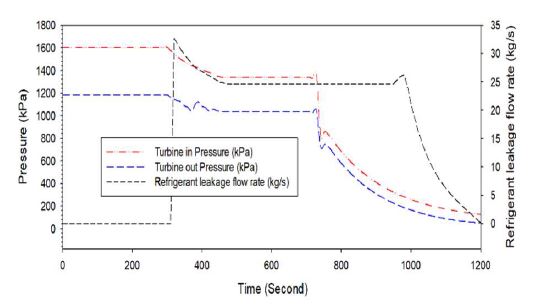
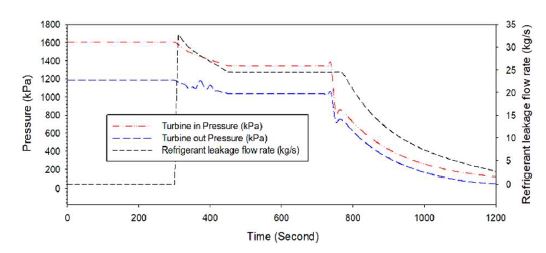
However, the existing refrigerant reserves of 4.54 m3 were reduced to 0.16 m3 owing to the leakage of the refrigerant, confirming a decrease of 96.5% in the refrigerant quantity. Figure 4 shows the pressure gradient in the turbine inlet and outlet during the refrigerant outflow process and the amount of refrigerant leakage. A pressure drop of 16.4% and 77.5% occurred at the initial leakage point and the dry operation point of the refrigerant pump, respectively. The leakage increased to a maximum of 32.64 kg/s and reached an average flow rate of 21.0 kg/s.
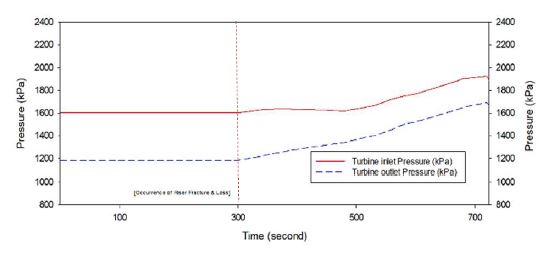
In accordance with the fracture of the riser, the inlet temperature of the deep seawater increases owing to the inflow of surface seawater from the damaged part, thereby reducing the turbine output and evaporative heat quantity. In this phenomenon, an increase in the temperature of deep seawater reduces the amount of condensation heat, and the remaining steam increases the pressure of the storage tank, thereby increasing the evaporation pressure and reducing the evaporation of the refrigerant. The output of the turbine gradually decreased until it rapidly decreased at 724 s, and converged to 0. A zero output of the turbine occurs when gas flows into the refrigerant pump, resulting in a 100% refrigerant storage rate in the liquid separator because of the high evaporation pressure. In other words, the increase in the system pressure at the inlet of the turbine leads the flow rate of the circulation pump to reach a value of 0.
The system pressure increased up to 1920 kPa with respect to the 0 kW output at 724 s. With this pressure increase, turbine’s inlet and outlet pressure difference decreased from 413.7 kPa to 183.8 kPa. Figure 5 shows a performance comparison between the reference model and refrigerant leakage and rise loss. The gradients of the turbine inlet and outlet pressures are shown in Figure 6.
5. Results of OTEC Simulation with improved operation and control system
5.1 Refrigerant leakage
Control of the refrigerant level is widely used in chemical and petroleum plant industries. The effect of refrigerant leakage varies depending on its type [15]. As the receiver tank level decreases with time, the inflow of the liquid-phase refrigerant to the refrigerant circulation pump can shutdown the system.
In this study, an alarm value of 20% and a system stop value of 15% were established by referring to a pre-existing model in a 20 kW OTEC system. Alarm and system stop conditions were provided for a duration of 2 min to prevent system error.
Refrigerant leakage occurred at 300 s. The receiver tank volume level reduced to below 20% at 582 s and below 15% at 776 s, where system shutdown occurred. This leads to shutdown of the refrigerant pump operation, opening of the bypass valve, and shutdown of refrigerant recirculation. Figure 7 shows the turbine inlet and outlet pressure gradients and the refrigerant leakage during the refrigerant outflow process. The leakage increased to a maximum of 32.8 kg/s; the refrigerant leaked at an average flow rate of 17.9 kg/s.
5.2 Fracture and loss of riser
The riser used in the OTEC mainly consists of FRP material, thus utilizing its benefits by enabling a 3.95 m/s intake flow rate at 1000 m depth [16]. However, a velocity above this level and extra external forces can damage the riser, leading to the inflow of warm surface seawater. This leads to a temperature increase in the condensate water, reducing the gap between surface seawater (heat source) and deep seawater (coolant) [17].
In this case, operation is possible by adjusting the RPM of the refrigerant pump to operate up to a 13° gradient and up to 18°C of deep water temperature without liquid refrigerant, but the system will shut down if the temperature difference is less than 13°. To solve this problem, the system is complemented by adjusting the control system to shut down at a net power of 391.7 kW. To protect the system from riser damage, an alarm should be set up at the point of a 20% decrease in temperature difference and should be shut down at 30%.
The temperature difference of seawater dropped below the alarm point of 21°C after 190 s of operation. After 310 s, the system shutdown occurred owing to the low temperature difference of 8°C. At the point of the alarm signal, the power output reduced by 38.8% compared with that at the initial state, with a rate of 646.4 kW. The flow rate was 92.2 kg/s; this was 18.2% less than the initial flow rate. At the system shutdown point, the power output was 426.6 kW; this was 59.6% less than the initial output. The flow rate at the shutdown point is 76.3 kg/s. Therefore, the control system developed in this study can successfully prevent damage caused by abnormal conditions such as the inflow of liquid refrigerants to the turbine or power generation below the rated net output. Figure 8 shows the analysis results obtained by applying the alarm and shutdown system for the refrigerant leakage and riser loss.
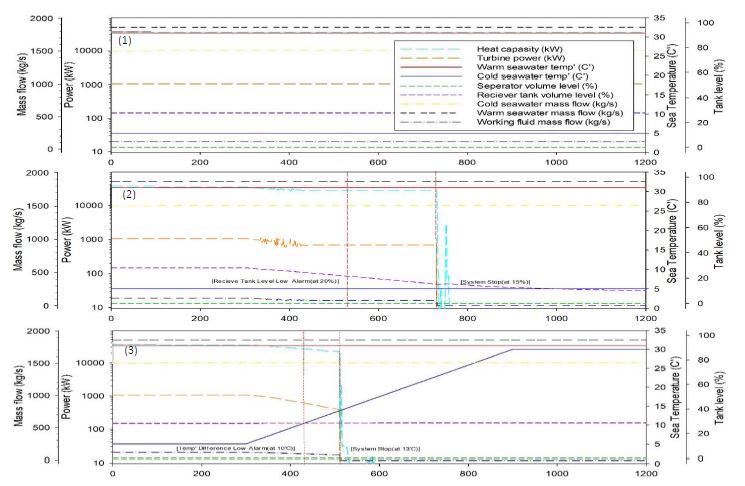
Performance Characteristics with Low-Level Control System of (1) Standard, (2) Refrigerant Leakage, and (3) Riser Fracture and Loss
The control modes presented through hazard analysis were identified in this study. The control module for refrigerant leakage and riser fracture aims to only prevent damage and not rehabilitation.
6. Conclusion
Analysis of hazard factors of OTEC was performed in this study to establish an automated control system to prevent system impact. The system impact was analyzed using dynamic simulation to prevent the impact. The following dynamic simulation conclusions were observed.
- (1) The effect of refrigerant leakage in an OTEC system is varies depending on the point of occurrence. The leakage process in the refrigerant storage tank results in dry operation of the pump and system shutdown. To cope with this problem, a control system at the tank level was established with a system shutdown at a level of 15% to prevent hazards.
- (2) The rapid increase in the deep seawater temperature owing to riser fracture leads to an increase in the internal pressure of the system to 1,925 kPa, thus inhibiting the evaporation of the working fluid. In addition, a large amount of liquid-phase refrigerant enters the liquid separator, resulting in liquid inflow to the turbine. To solve this problem, the system shutdown was set at a point where the temperature difference between the surface and deep seawater was more than 30% of the mean temperature difference, thus preventing liquid phase refrigerant generation in advance.
The control modules of the OTEC derived from this study are proposed for stabilizing the operation of power generation facilities and will be utilized for establishing an optimal control system for demonstration plants.
Acknowledgments
This research was financially supported by the grant from the National R&D Project of “Demonstration of power generation system and RCI technology using ship waste heat” funded by the Ministry of Oceans and Fisheries, Korea (PMS5380).
Author Contributions
Conceptualization, S. Lim; Methodology, S. Lim; Software, S. Lim; Validation, S. Lim; Formal Analysis, J. Yoon; Investigation, H. Lee; Resources, H. Lee; Data Curation, S. Lim; Writing—Original Draft Preparation, S. Lim; Writing—Review & Editing, J. Yoon; Visualization, S. Lim; Supervision, S. Lim; Project Administration, H. Kim; Funding Acquisition, H. Lee.
References
-
L. A. Vega, Ocean Thermal Energy Conversion, Meyers R. A. (eds) Encyclopedia of Sustainability Science and Technology, New York, USA: Springer, 2012.
[https://doi.org/10.1007/978-1-4419-0851-3_695]

- H. S. LEE, S. W. Cha, Y. G. Jung, B. S. Choi, and H. J. Kim, “Design and experiment of the 20kW OTEC plant,” Proceedings of KAOSTS Spring Conference, pp. 2448-2452, 2014 (in Korean).
-
S. T. Lim, H. J. Kim, and H. S. Lee, “Dynamic simulation of performance change of MW-class OTEC according to seawater flow rate,” Journal of the Korean Society for Power System Engineering, vol. 23, no. 1, pp. 48-56, 2019 (in Korean).
[https://doi.org/10.9726/kspse.2019.23.1.048]

-
Y. J. Kwon, D. H. Jung, and H. J. Kim, “Design of riser in 1MW OTEC system mounted on floating barge,” Journal of the Korean Science for Marine Environment & Energy, vol. 18, no. 1, pp. 22-28, 2015 (in Korean).
[https://doi.org/10.7846/JKOSMEE.2015.18.1.22]

- J. B. Seo, J. H. Moon, H. S. Lee, and H. J. Kim, “Performance evaluation and modification plan of the 1MW OTEC turbine,” Korean Science for Marine Environment & Energy Fall Conference, pp. 147-148, 2019 (in Korean).
- Graphic products staff, Hazard Analysis Risk Assessment, https://www.graphicproducts.com/articles/hazard-analysis-risk-assessment, / Accessed Date. 24.11.2022.
- International Organization for Standardization, Space Systems Risk Management, ISO 17666, 2016.
-
S. H. Park, J. Oh, S. Cho, K. Kang, C. Min, and J. -Y. Jung, “Reliability evaluation of conceptual design for the dehydration package,” Journal of Mechanical Science and Technology, vol. 32, pp. 5263-5271, 2018.
[https://doi.org/10.1007/s12206-018-1024-9]

-
H. Noh, K. Kang, C. Huh, S. -G. Kang, and Y. Seo, “Identification of potential hazardous events of unloading system and CO2 storage tanks of an intermediate storage terminal for the Korea clean carbon storage project 2025, International Journal of Safety and Security Engineering, vol. 8, no. 2, pp. 258-265, 2018.
[https://doi.org/10.2495/SAFE-V8-N2-258-265]

-
X. -Y. Zhou, Z. -J. Liu, F. -W Wang, Z. -L. Wu, and R. -D. Cui, “Towards applicability evaluation of hazard analysis methods for autonomous ships,” Ocean Engineering, vol. 214, pp. 1-19, 2020.
[https://doi.org/10.1016/j.oceaneng.2020.107773]

- Korea Research Institute of Ships & Ocean Engineering, Development of the utilization technology of deep seawater thermal energy (1 MW OTEC plant) Report, 2015.
-
S. -H. Oh and S. -W. Kim, Subsystem hazard analysis on an offshore waste disposal facility, International Journal of Environmental Research and Public Health, vol. 17, no. 21, p. 7755, 2020.
[https://doi.org/10.3390/ijerph17217755]

-
N. Chemmangattuvalappil and S. J. C. E. P. S. Chong, Basics of process simulation with Aspen HYSYS, Chemical Engineering Process Simulation, p. 233, 2017.
[https://doi.org/10.1016/B978-0-12-803782-9.00011-X]

-
S. T. Lim, H. S. Lee, J. H. Moon, and H. J. Kim, “Simulation data of regional economic analysis of otec for applicable area,” Processes, vol. 8, no. 9, p. 1107, 2020.
[https://doi.org/10.3390/pr8091107]

-
W. L. Luyben, Liquid level control: Simplicity and complexity, Journal of Process Control, vol. 86, pp. 57-64, 2020.
[https://doi.org/10.1016/j.jprocont.2019.12.008]

-
R. Adiputra and T. Utsunomiya, “Stability based approach to design cold-water pipe (CWP) for ocean thermal energy conversion (OTEC),” Applied Ocean Research, vol. 92, 2019.
[https://doi.org/10.1016/j.apor.2019.101921]

-
M. L. Syamsuddin, A. Attamimi, A. P. Nugraha, S. Gibran, A. Q. Afifah, and N. Oriana, “OTEC potential in the Indonesian seas,” Energy Procedia, vol. 65, pp. 215-222, 2015.
[https://doi.org/10.1016/j.egypro.2015.01.028]


